PUBLISHER: Mordor Intelligence | PRODUCT CODE: 2116477

PUBLISHER: Mordor Intelligence | PRODUCT CODE: 2116477
Specialty Pharmaceuticals - Market Share Analysis, Industry Trends & Statistics, Growth Forecasts (2026 - 2031)
According to Mordor Intelligence, the specialty pharmaceuticals market size was valued at USD 16.37 billion in 2025 and estimated to grow from USD 22.12 billion in 2026 to reach USD 99.63 billion by 2031, at a CAGR of 35.12% during the forecast period (2026-2031).
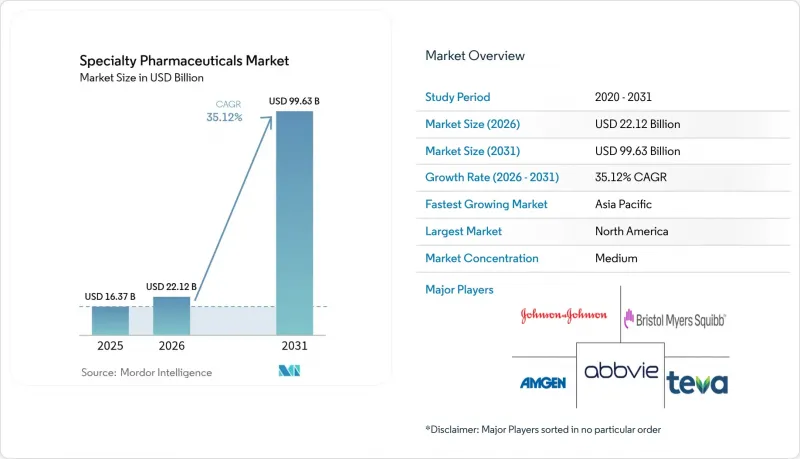
This report is Segmented by Application (Oncology, Immunology, Endocrinology, Neurology, and More), Drug Class (Biologics, and More), Mode of Administration (Injectable/Parenteral, Oral, and More), Distribution Channel, (hospital Pharmacies, and More), and Geography (North America, Europe, Asia-Pacific, South America, Middle East and Africa). The Market Forecasts are Provided in Terms of Value (USD).
Global Specialty Pharmaceuticals Market Trends and Insights
Rising Prevalence of Chronic & Rare Diseases
More than 300 million people live with one of roughly 5,500 recognized rare diseases, yet diagnostic rates remain under 50% in many low- and middle-income countries.Next-generation sequencing now costs well below USD 1,000 per genome, enabling earlier identification of monogenic disorders and widening the treatment pool for enzyme-replacement and gene therapies. Chronic disease incidence is also climbing; six in ten U.S. adults live with at least one chronic condition, intensifying demand for long-term oncology, immunology, and endocrine regimens. In 2024, the FDA granted 46 orphan-drug designations, including gene therapies targeting Angelman syndrome and pregnancy complications, underscoring sustained sponsor interest in ultra-rare indications. Accelerated-approval corridors, relied on for 72% of 2025 novel approvals, enable faster market entry but place post-marketing evidence burdens on manufacturers.
Rapid Expansion of Biologics & Biosimilars Pipeline
Seven orphan biologics cleared FDA review in 2024, headlined by the first engineered T-cell receptor therapy and a gene-edited treatment for leukodystrophy. Biosimilars are catching up; U.S. adalimumab analogs captured over 90% penetration by Q4 2024, eroding a USD 21 billion franchise. Europe's prescribing quotas accelerate similar uptake, although interchangeable rules differ by country, complicating pan-European launches. China approved 82 innovative biologics in 2024, while CDMO majors are racing to open vector suites that reduce lead times from 18 months to near 12 months. Autologous CAR-T manufacture still needs 22-28 days per patient, pressuring innovators to develop off-the-shelf allogeneic platforms.
Escalating Treatment Costs & Payer Cost-Containment
Medicare's first round of negotiated prices delivered mean discounts of 79%, slashing Enbrel to USD 2,355 and Imbruvica to USD 9,319 per month. Without out-of-pocket caps at USD 2,000 from 2025, plans and manufacturers shoulder greater cost, accelerating formulary exclusions and step-therapy rules. Private PBMs now require metformin trials before GLP-1 coverage, and UnitedHealthcare excluded Zepbound in favor of Wegovy to leverage higher rebates. Gene-therapy pricing remains contentious; Casgevy's USD 2.2 million tag faces scrutiny over 20-year durability, yet pivotal data cover only 31 patients. International reference pricing in Germany and other EU markets further compresses launch-year margins.
Other drivers and restraints analyzed in the detailed report include:
- Growth of Integrated Specialty-Pharmacy Networks
- Orphan-Drug Incentives & Favorable Reimbursement
- Complex Cold-Chain & Handling Logistics
For complete list of drivers and restraints, kindly check the Table Of Contents.
Segment Analysis
Oncology retained 35.55% of the specialty pharmaceuticals market share in 2025, driven by checkpoint inhibitors, antibody-drug conjugates, and CAR-T therapies. Rare-disease therapies, while smaller, are set to grow at a 36.85% CAGR through 2031 as the FDA fast-tracks ultra-orphan candidates. The specialty pharmaceuticals market size for oncology is projected to surpass USD 40 billion by 2031, while rare-disease revenue could multiply six-fold on the same horizon. Competitive intensity rises as new PD-1/TIGIT combinations and bispecific antibodies challenge incumbents.
Growth vectors differ. Oncology pipelines prioritize tumor-agnostic indications, whereas rare-disease sponsors focus on first-in-class gene-replacement approaches. Reimbursement hurdles diverge as well: value-based oncology contracts hinge on overall survival endpoints, while orphan therapies often face single-payer negotiations over ultra-high per-patient prices. The player mix reflects that divergence: big pharma dominates oncology, whereas venture-backed biotech maintains leadership positions in diseases with <10,000 patients globally.
Biologics accounted for 60.53% of the 2025 specialty pharmaceutical market, buoyed by monoclonal antibodies, fusion proteins, and recombinant enzymes. Gene and cell therapies, though <5% revenue, are set for a 37.75% CAGR to 2031 as manufacturing bottlenecks ease. Within small molecules, targeted kinase inhibitors remain entrenched but face earlier generic erosion.
Commercial dynamics favor biologics for chronic diseases, with high refill frequency sustaining revenue, while one-time gene therapies rely on payer acceptance of multi-million-dollar price tags. Manufacturing scale is the swing factor; a single 2,000-liter bioreactor run can generate USD 500 million of monoclonal antibody supply, whereas autologous cell-therapy capacity remains patient-specific. Platform advances such as CRISPR-based off-the-shelf edits could shift that calculus.
Complete Report Scope:
- By Application
- Oncology
- Immunology
- Endocrinology
- Infectious Diseases
- Neurology
- Rare & Orphan Disorders
- Cardiovascular
- Ophthalmology
- By Drug Class
- Biologics
- Small-molecule specialty drugs
- Gene & Cell Therapies
- Peptide Therapeutics
- By Mode of Administration
- Injectable/ Parenteral
- Oral
- Intravitreal / Ocular
- Others
- By Distribution Channel
- Hospital Pharmacies
- Specialty Pharmacies
- Online Pharmacies
- By Geography
- North America
- United States
- Canada
- Mexico
- Europe
- Germany
- United Kingdom
- France
- Italy
- Spain
- Rest of Europe
- Asia-Pacific
- China
- India
- Japan
- Australia
- South Korea
- Rest of Asia-Pacific
- Middle East and Africa
- GCC
- South Africa
- Rest of Middle East and Africa
- South America
- Brazil
- Argentina
- Rest of South America
- North America
Geography Analysis
North America generated 46.62% of 2025 revenue as Medicare Part D specialty spend exceeded USD 133 billion, even before IRA negotiations trimmed headline prices. The United States commands the region through higher unit prices. Keytruda exceeds USD 200,000 annually and dense infusion-center networks. Canada enforces median international pricing, delaying several gene-therapy launches, while Mexico's social-security expansion broadens biologic access but leaves large uninsured populations exposed.
Europe trails in revenue but leads in biosimilar penetration. Germany's early benefit assessment and AMNOG negotiations cut list prices by up to 50% within 1 year of launch. France, Italy, and Spain pursue parallel HTA reviews even under the EU's 2025 joint-assessment regulation, extending market-access timelines by 12-18 months. The United Kingdom's QALY-based pricing cap keeps many gene therapies in "managed access" schemes.
Asia-Pacific delivers the steepest growth trajectory at a 36.22% CAGR and could match North America's revenue by 2031. China green-lit 82 novel therapies in 2024, and Beijing's volume-based procurement lowers prices yet expands volumes. India's biosimilar export boom benefits from FDA mutual inspections; Biocon and Dr. Reddy's secure first-to-file slots for denosumab and aflibercept analogs. Japan's Sakigake pathway speeds review, but biennial price cuts erode five-year revenue curves. Australia, South Korea, and GCC states broaden reimbursement but still negotiate aggressive risk-sharing deals, limiting upside.
- Abbvie
- Amgen
- AstraZeneca
- Bayer
- Biogen
- BioMarin
- Boehringer Ingelheim
- Bristol-Myers Squibb
- CSL Behring
- Eli Lilly and Company
- Gilead Sciences
- GlaxoSmithKline
- Horizon Therapeutics
- Johnson & Johnson
- Merck
- Moderna
- Novartis
- Novo Nordisk
- Pfizer
- Regeneron
- Roche
- Sanofi
- Sarepta Therapeutics
- Takeda Pharmaceuticals
- Teva Pharmaceutical Industries
- UCB
- Vertex Pharmaceuticals
Additional Benefits:
- The market estimate (ME) sheet in Excel format
- 3 months of analyst support
TABLE OF CONTENTS
1 Introduction
- 1.1 Study Assumptions & Market Definition
- 1.2 Scope of the Study
2 Research Methodology
3 Executive Summary
4 Market Landscape
- 4.1 Market Overview
- 4.2 Market Drivers
- 4.2.1 Rising Prevalence of Chronic & Rare Diseases
- 4.2.2 Rapid Expansion of Biologics & Biosimilars Pipeline
- 4.2.3 Growth of Integrated Specialty-Pharmacy Networks
- 4.2.4 Orphan-Drug "Priority Review Voucher" Arbitrage
- 4.2.5 Pay-For-Performance Contracts Unlocking Niche Access
- 4.3 Market Restraints
- 4.3.1 Escalating Treatment Costs & Payer Cost-Containment
- 4.3.2 Complex Cold-Chain & Handling Logistics
- 4.3.3 Fragmented Real-World-Evidence Standards Slowing Uptake
- 4.3.4 Sustainability Pressure on Single-Use Delivery Devices
- 4.4 Supply-Chain Analysis
- 4.5 Regulatory Landscape
- 4.6 Technological Outlook
- 4.7 Porter's Five Forces
- 4.7.1 Threat of New Entrants
- 4.7.2 Bargaining Power of Suppliers
- 4.7.3 Bargaining Power of Buyers
- 4.7.4 Threat of Substitutes
- 4.7.5 Competitive Rivalry
5 Market Size & Growth Forecasts (Value, USD)
- 5.1 By Application
- 5.1.1 Oncology
- 5.1.2 Immunology
- 5.1.3 Endocrinology
- 5.1.4 Infectious Diseases
- 5.1.5 Neurology
- 5.1.6 Rare & Orphan Disorders
- 5.1.7 Cardiovascular
- 5.1.8 Ophthalmology
- 5.2 By Drug Class
- 5.2.1 Biologics
- 5.2.2 Small-molecule specialty drugs
- 5.2.3 Gene & Cell Therapies
- 5.2.4 Peptide Therapeutics
- 5.3 By Mode of Administration
- 5.3.1 Injectable/ Parenteral
- 5.3.2 Oral
- 5.3.3 Intravitreal / Ocular
- 5.3.4 Others
- 5.4 By Distribution Channel
- 5.4.1 Hospital Pharmacies
- 5.4.2 Specialty Pharmacies
- 5.4.3 Online Pharmacies
- 5.5 By Geography
- 5.5.1 North America
- 5.5.1.1 United States
- 5.5.1.2 Canada
- 5.5.1.3 Mexico
- 5.5.2 Europe
- 5.5.2.1 Germany
- 5.5.2.2 United Kingdom
- 5.5.2.3 France
- 5.5.2.4 Italy
- 5.5.2.5 Spain
- 5.5.2.6 Rest of Europe
- 5.5.3 Asia-Pacific
- 5.5.3.1 China
- 5.5.3.2 India
- 5.5.3.3 Japan
- 5.5.3.4 Australia
- 5.5.3.5 South Korea
- 5.5.3.6 Rest of Asia-Pacific
- 5.5.4 Middle East and Africa
- 5.5.4.1 GCC
- 5.5.4.2 South Africa
- 5.5.4.3 Rest of Middle East and Africa
- 5.5.5 South America
- 5.5.5.1 Brazil
- 5.5.5.2 Argentina
- 5.5.5.3 Rest of South America
- 5.5.1 North America
6 Competitive Landscape
- 6.1 Market Concentration
- 6.2 Market Share Analysis
- 6.3 Company Profiles (includes Global level Overview, Market level overview, Core Segments, Financials as available, Strategic Information, Market Rank/Share for key companies, Products & Services, Recent Developments)
- 6.3.1 AbbVie
- 6.3.2 Amgen
- 6.3.3 AstraZeneca
- 6.3.4 Bayer AG
- 6.3.5 Biogen
- 6.3.6 BioMarin
- 6.3.7 Boehringer Ingelheim
- 6.3.8 Bristol Myers Squibb
- 6.3.9 CSL Behring
- 6.3.10 Eli Lilly
- 6.3.11 Gilead Sciences
- 6.3.12 GSK plc
- 6.3.13 Horizon Therapeutics
- 6.3.14 Johnson & Johnson (Janssen)
- 6.3.15 Merck & Co.
- 6.3.16 Moderna
- 6.3.17 Novartis
- 6.3.18 Novo Nordisk
- 6.3.19 Pfizer
- 6.3.20 Regeneron
- 6.3.21 Roche
- 6.3.22 Sanofi
- 6.3.23 Sarepta Therapeutics
- 6.3.24 Takeda
- 6.3.25 Teva
- 6.3.26 UCB Pharma
- 6.3.27 Vertex Pharmaceuticals
7 Market Opportunities & Future Outlook
- 7.1 White-space & Unmet-need Assessment

