PUBLISHER: Mordor Intelligence | PRODUCT CODE: 2116489

PUBLISHER: Mordor Intelligence | PRODUCT CODE: 2116489
Controlled Release Drug Delivery - Market Share Analysis, Industry Trends & Statistics, Growth Forecasts (2026 - 2031)
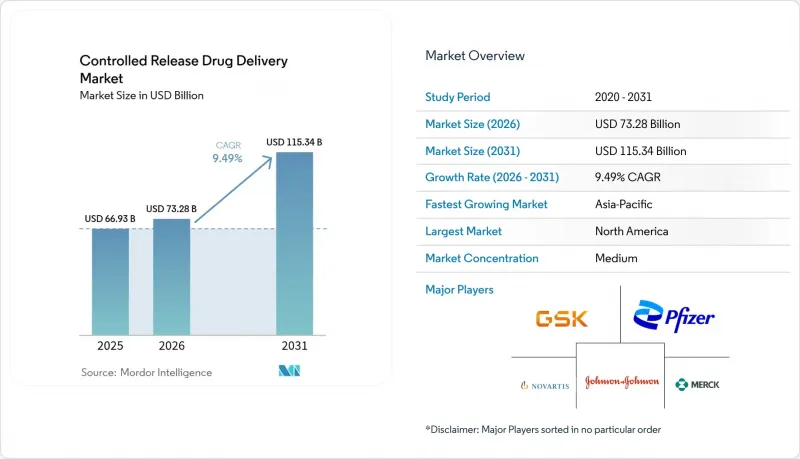
According to Mordor Intelligence, the controlled release drug delivery market size was valued at USD 66.93 billion in 2025 and estimated to grow from USD 73.28 billion in 2026 to reach USD 115.34 billion by 2031, at a CAGR of 9.49% during the forecast period (2026-2031).
This report is Segmented by Technology (Micro Encapsulation, Transdermal Systems, Long-Acting Injectable Depots and More), Route of Administration (Oral Controlled-Release, Parenteral and More), Polymer / Carrier Type (PLGA / PLA, Cellulose Derivatives and More) and Geography (North America, Europe, Asia-Pacific, and More). The Market Forecasts are Provided in Terms of Value (USD).
Global Controlled Release Drug Delivery Market Trends and Insights
Escalating chronic-disease burden
Diabetes, cardiovascular disease, and cancer together affect more than 1.5 billion people and require therapies that promote adherence over many years. Controlled release tablets such as extended-release ketamine achieved a 6.1-point decline in MADRS scores versus placebo while limiting adverse reactions, demonstrating the clinical pay-off from stable plasma profiles.Healthcare buyers under value-based payment rules favor regimens that lower readmissions, which supports ongoing expansion of the controlled release drug delivery market. Firms also rely on long-acting platforms to refresh generic molecules and defend exclusivity as biologics meet biosimilar pressure.
Rapid growth in geriatric & pediatric cohorts
Older adults often juggle five or more prescriptions each day; children need palatable options at lower strengths. Innovations such as Lonza's Enprotect size 9 capsule allow acid-sensitive actives to release in the intestine without extra coatings, cutting formulation steps. Weekly oral risperidone maintained steady plasma levels in schizophrenia patients and raised satisfaction scores in phase 3 trials, showing that the controlled release drug delivery market can address adherence for vulnerable populations.
High CMC & scale-up costs vs. conventional forms
Sophisticated release coatings and multi-layer tablets demand analytical protocols that stretch development by up to two years relative to immediate-release pills, boosting cost and complexity. Smaller firms often outsource to CDMOs, paying a premium that narrows price competitiveness in cost-sensitive markets, tempering uptake within the controlled release drug delivery market.
Other drivers and restraints analyzed in the detailed report include:
- Breakthroughs in micro-/nano-encapsulation polymers
- Shift toward once-weekly/monthly dosing
- Complex multi-jurisdictional regulatory pathway
For complete list of drivers and restraints, kindly check the Table Of Contents.
Segment Analysis
Transdermal platforms led the controlled release drug delivery market with a 31.83% revenue share in 2025, owing to ease of self-administration and proven manufacturing lines. Nano- and lipid-based systems, however, are set to post a 12.05% CAGR through 2031 as precision medicine rises. Osmotic pump tablets sustain zero-order kinetics unaffected by food intake, while implantable pumps meet oncology needs for local micro-dosing. LNPs leverage pandemic-era capacity to speed oncology and protein replacement programs, cementing their place in the controlled release drug delivery market.
Competitive focus now centers on carrier architecture. Branched-tail LNPs direct mRNA payloads to lung dendritic cells, widening respiratory applications. Push-pull osmotic tablets remove variability from gastric pH, aiding chronic disease control. Together these advances give manufacturers flexibility to match molecule, route, and patient need, helping the controlled release drug delivery market sustain robust innovation cycles.
Complete Report Scope:
- By Technology
- Micro-encapsulation
- Transdermal Systems
- Long-acting Injectable Depots
- Targeted Nano / Lipid Carriers
- Implantable Pumps & Stents
- Osmotic Pump Tablets
- By Route of Administration
- Oral Controlled-Release
- Parenteral (Injectable)
- Transdermal
- Inhalation
- Ocular
- By Polymer / Carrier Type
- PLGA / PLA
- PEG & PEG-blends
- Cellulose Derivatives
- Lipid Nanoparticles / SLNs
- Polyanhydrides
- By Geography
- North America
- United States
- Canada
- Mexico
- Europe
- Germany
- United Kingdom
- France
- Italy
- Spain
- Rest of Europe
- Asia-Pacific
- China
- Japan
- India
- Australia
- South Korea
- Rest of Asia-Pacific
- Middle East and Africa
- GCC
- South Africa
- Rest of Middle East and Africa
- South America
- Brazil
- Argentina
- Rest of South America
- North America
Geography Analysis
North America maintained leadership with 36.02% revenue in 2025, enabled by strong R&D outlays, rapid FDA breakthrough designations, and a deep skilled labor pool. Lilly's USD 9 billion Indiana build-out for tirzepatide illustrates continuing commitment to complex production on-shore. Novo Nordisk's USD 4.1 billion expansion in North Carolina doubles peptide capacity, securing supply for long-acting injectables. These investments strengthen local sourcing for the controlled release drug delivery market.
Asia Pacific is projected to be the fastest region with an 11.52% CAGR, powered by regulatory harmonization through the Pharmaceutical Inspection Co-operation Scheme and large-scale capital projects. China approved 40 innovative drugs in 2023 under accelerated reviews and logged 18,503 registration filings, underscoring pipeline depth. Lonza's capsule lines in India and China and WuXi STA's 169-acre Taixing API hub reveal supply-side commitment to support local and global demand.
Europe shows steady uptake. The region's tight quality codes create a reputation edge that appeals to multinational sponsors. CordenPharma's €900 million peptide platform expansion across Colorado and European sites bridges transatlantic supply for GLP-1 compounds in obesity and diabetes care. Lonza's Innovaform Accelerator in France accelerates formulation co-development, giving EU clients fast access to controlled release expertise. Pan-regional alignment under the European Medicines Agency also helps smaller firms navigate the controlled release drug delivery market with fewer duplicative filings.
- Johnson & Johnson
- GlaxoSmithKline
- Pfizer
- Merck
- Novartis
- Viatris
- Solventum
- Lonza Group
- Adare Pharma Solutions
- Colorcon
- Corium, Inc.
- Bayer
- Abbvie
- Hisamitsu Pharmaceutical
- Teva Pharmaceutical Industries
- AstraZeneca
- Amgen
- Evonik Industries
- Medtronic
- Beckton Dickinson
Additional Benefits:
- The market estimate (ME) sheet in Excel format
- 3 months of analyst support
TABLE OF CONTENTS
1 Introduction
- 1.1 Study Assumptions and Market Definition
- 1.2 Scope of the Study
2 Research Methodology
3 Executive Summary
4 Market Landscape
- 4.1 Market Overview
- 4.2 Market Drivers
- 4.2.1 Escalating Chronic-Disease Burden
- 4.2.2 Rapid Growth In Geriatric & Pediatric Cohorts
- 4.2.3 Breakthroughs In Micro-/Nano-Encapsulation Polymers
- 4.2.4 Shift Toward Once-Weekly / Monthly Dosing & Self-Administration
- 4.2.5 Mrna-Lipid Infrastructure Repurposed For Non-Vaccine Therapeutics
- 4.2.6 AI-Driven Formulation Optimisation Platforms
- 4.3 Market Restraints
- 4.3.1 High CMC & Scale-Up Costs Vs Conventional Dosage Forms
- 4.3.2 Complex, Multi-Jurisdictional Regulatory Pathway
- 4.3.3 API Stability Challenges Inside Long-Acting Matrices
- 4.3.4 Tight Global Supply Of Specialised GRAS Excipients
- 4.4 Value / Supply-Chain Analysis
- 4.5 Regulatory Landscape
- 4.6 Technology Outlook
- 4.7 Porter's Five Forces Analysis
- 4.7.1 Bargaining Power of Suppliers
- 4.7.2 Bargaining Power of Buyers
- 4.7.3 Threat of New Entrants
- 4.7.4 Threat of Substitutes
- 4.7.5 Intensity of Competitive Rivalry
5 Market Size and Growth Forecasts (Value-USD)
- 5.1 By Technology
- 5.1.1 Micro-encapsulation
- 5.1.2 Transdermal Systems
- 5.1.3 Long-acting Injectable Depots
- 5.1.4 Targeted Nano / Lipid Carriers
- 5.1.5 Implantable Pumps & Stents
- 5.1.6 Osmotic Pump Tablets
- 5.2 By Route of Administration
- 5.2.1 Oral Controlled-Release
- 5.2.2 Parenteral (Injectable)
- 5.2.3 Transdermal
- 5.2.4 Inhalation
- 5.2.5 Ocular
- 5.3 By Polymer / Carrier Type
- 5.3.1 PLGA / PLA
- 5.3.2 PEG & PEG-blends
- 5.3.3 Cellulose Derivatives
- 5.3.4 Lipid Nanoparticles / SLNs
- 5.3.5 Polyanhydrides
- 5.4 By Geography
- 5.4.1 North America
- 5.4.1.1 United States
- 5.4.1.2 Canada
- 5.4.1.3 Mexico
- 5.4.2 Europe
- 5.4.2.1 Germany
- 5.4.2.2 United Kingdom
- 5.4.2.3 France
- 5.4.2.4 Italy
- 5.4.2.5 Spain
- 5.4.2.6 Rest of Europe
- 5.4.3 Asia-Pacific
- 5.4.3.1 China
- 5.4.3.2 Japan
- 5.4.3.3 India
- 5.4.3.4 Australia
- 5.4.3.5 South Korea
- 5.4.3.6 Rest of Asia-Pacific
- 5.4.4 Middle East and Africa
- 5.4.4.1 GCC
- 5.4.4.2 South Africa
- 5.4.4.3 Rest of Middle East and Africa
- 5.4.5 South America
- 5.4.5.1 Brazil
- 5.4.5.2 Argentina
- 5.4.5.3 Rest of South America
- 5.4.1 North America
6 Competitive Landscape
- 6.1 Market Concentration
- 6.2 Market Share Analysis
- 6.3 Company profiles (includes Global level Overview, Market level overview, Core Segments, Financials as available, Strategic Information, Market Rank/Share for key companies, Products and Services, and Recent Developments)
- 6.3.1 Johnson & Johnson
- 6.3.2 GlaxoSmithKline plc
- 6.3.3 Pfizer Inc.
- 6.3.4 Merck & Co., Inc.
- 6.3.5 Novartis AG
- 6.3.6 Viatris
- 6.3.7 Solventum
- 6.3.8 Lonza Group
- 6.3.9 Adare Pharma Solutions
- 6.3.10 Colorcon
- 6.3.11 Corium, Inc.
- 6.3.12 Bayer AG
- 6.3.13 AbbVie Inc.
- 6.3.14 Hisamitsu Pharmaceutical
- 6.3.15 Teva Pharmaceutical Industries
- 6.3.16 AstraZeneca plc
- 6.3.17 Amgen Inc.
- 6.3.18 Evonik Industries
- 6.3.19 Medtronic plc
- 6.3.20 Becton, Dickinson & Co.
7 Market Opportunities and Future Outlook
- 7.1 White-Space and Unmet-Need Assessment

