PUBLISHER: Mordor Intelligence | PRODUCT CODE: 2117320

PUBLISHER: Mordor Intelligence | PRODUCT CODE: 2117320
Financial Advisory Services - Market Share Analysis, Industry Trends & Statistics, Growth Forecasts (2026 - 2031)
According to Mordor Intelligence, the financial advisory services market size is expected to grow from USD 115.84 billion in 2025 to USD 122.39 billion in 2026 and is forecast to reach USD 161.19 billion by 2031 at 5.66% CAGR over 2026-2031.
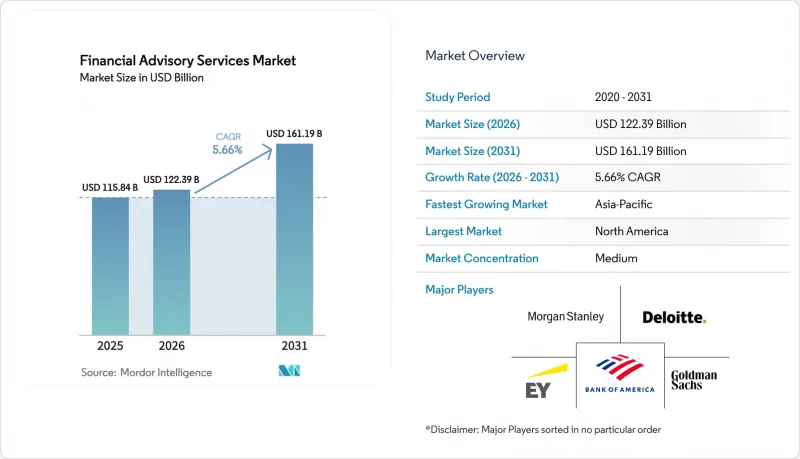
This report is Segmented by Service Type (Corporate Finance, and More), by Organization Size (Large Enterprises, Small and Medium-Sized Enterprises), by Industry Vertical (BFSI, and More), by Service Channel (Human Advisory, and More), by Delivery Mode (On-Site Consulting, and More), and by Region (North America, and More). The Market Forecasts are Provided in Terms of Value (USD).
Global Financial Advisory Services Market Trends and Insights
AI-Enabled Hyper-Personalized Advice Uptake
Artificial intelligence is reshaping how advisory firms collect, process, and apply client data, creating bespoke portfolios that adapt in real time to shifting life events, tax regimes, and market conditions. Federal Reserve surveys put AI penetration among financial-services workers at 20%-40%, with year-on-year growth reaching up to 145%. Morgan Stanley's wealth arm, stewarding more than USD 4.2 trillion, relies on proprietary AI research to sharpen asset allocation and deepen engagement. Where human advisers once sifted spreadsheets, machine-learning engines now scan millions of data points in seconds, freeing professionals to focus on complex planning. Adoption is particularly strong in digitally mature Asia-Pacific wealth hubs, where clients consider advanced analytics a hygiene factor rather than a differentiator. Firms that master AI-driven personalization earn higher wallet share and more durable client stickiness.
Shift From Commission to Fee-Based Models
Regulators and clients are accelerating the pivot toward fee transparency, reducing conflicts embedded in product commissions. T. Rowe Price already manages around USD 1.5 trillion on fee-aligned mandates, proving the commercial viability of asset-based charging. The Consumer Financial Protection Bureau has intensified its crackdown on opaque charges, labelling overdraft fees and similar levies "junk fees". Europe's MiFID II framework, which ring-fences advice fees, offers a blueprint now spreading to other regions. As firms pivot, stable recurring revenue streams improve valuation multiples, yet they also expose advisers to margin pressure if investment performance lags. Successful operators couple fee-based portfolios with high-touch planning, tax, and retirement strategies that reinforce perceived value.
Advisor Talent Shortage & Ageing Workforce
More than one-third of practicing advisers in North America and Western Europe are within a decade of retirement, creating a pipeline gap that constrains capacity and stresses service levels. Younger professionals gravitate toward technology or entrepreneurial roles offering flexible schedules and equity upside, leaving advisory firms scrambling to refresh ranks. Heightened regulatory complexity further raises entry barriers, demanding advanced credentials that require time and capital to acquire. In specialties such as estate planning, advisors with deep tax knowledge command premium compensation, escalating cost structures. Firms are responding with apprenticeship tracks, tuition reimbursement, and increased reliance on digital workflows that let senior advisers support a larger client base through junior staff.
Other drivers and restraints analyzed in the detailed report include:
- Democratization via Low-Cost Robo-Platforms
- Generational Wealth Transfer to Digital-Savvy Heirs
- Margin Compression from Passive Investing Wave
For complete list of drivers and restraints, kindly check the Table Of Contents.
Segment Analysis
Investment advisory services captured the largest 38.25% slice of the financial advisory services market in 2025 and will propel overall growth with a 7.29% CAGR to 2031. This combination of scale and velocity underscores the client's appetite for portfolios that integrate planning, tax, and estate considerations within single adviser relationships. As assets migrate toward fee-based accounts, the financial advisory services market size for investment advisory is projected to widen in absolute dollars at a pace that outstrips other categories. Major deal counsel, notably Capital One's USD 35 billion purchase of Discover Financial, spotlights how corporate finance teams lean on specialist advisers for valuation, structuring, and shareholder communications.
Across the wider service landscape, accounting and tax advisory services enjoy steady uptake as multijurisdictional reporting and ESG metrics create data-collection complexity. Digital-asset and succession-planning sub-segments, housed within "other services," register niche but rising contributions. Competitive differentiation now hinges on bundling: firms marrying investment management with holistic planning see lower churn and stronger cross-selling. As technology automates many allocation tasks, advisers redeploy bandwidth to behavioral coaching that addresses client biases and emotional triggers during volatile markets.
Large enterprises accounted for 63.10% of the financial advisory services market in 2025, reflecting entrenched relationships and complex balance-sheet requirements that demand bespoke advisory. Treasury optimization, debt structuring, and cross-border M&A ensure sticky mandates. However, the SME cohort, aided by digital onboarding and modular service bundles, is forecasted to expand at a 6.59% CAGR, increasing its share of the financial advisory services market size. Technology platforms lower ticket-size thresholds, allowing advisers to profitably serve family-owned manufacturers, tech startups, and professional partnerships that previously relied on in-house finance staffs or retail banks.
Many SMEs face regulatory burdens similar to large corporates-such as beneficial-ownership reporting and sustainability disclosures-yet lack specialized expertise. Cloud-based dashboards that consolidate cash-flow projections, tax calendars, and portfolio analytics empower owners to act swiftly. Leading advisers deploy AI chatbots to field routine queries, reserving human interaction for annual planning and transaction events. Geographic dispersion is widening; SMEs in Southeast Asia and Latin America increasingly seek US-dollar bond issuance advice, driving cross-border engagement.
Complete Report Scope:
- By Service Type
- Corporate Finance
- Accounting And Tax Advisory
- Investment
- Other Services
- By Organization Size
- Large Enterprises
- Small & Medium-sized Enterprises (SMEs)
- By Industry Vertical
- Banking, Financial Services, Insurance (BFSI)
- IT & Telecommunication
- Manufacturing
- Retail And E-Commerce
- Public Sector
- Healthcare And Pharmaceuticals
- Other Industry Verticals
- By Service Channel
- Human Advisory
- Hybrid Advisory
- Robo-Advisory
- By Delivery Mode
- On-site Consulting
- Remote / Virtual Consulting
- By Region
- North America
- United States
- Canada
- Mexico
- South America
- Brazil
- Argentina
- Chile
- Peru
- Rest of South America
- Europe
- United Kingdom
- Germany
- France
- Spain
- Italy
- Benelux (Belgium, Netherlands, and Luxembourg)
- Nordics (Sweden, Norway, Denmark, Finland, and Iceland)
- Rest of Europe
- Asia Pacific
- China
- India
- Japan
- South Korea
- Australia
- South-East Asia (Singapore, Indonesia, Malaysia, Thailand, Vietnam, and Philippines)
- Rest of Asia-Pacific
- Middle East and Africa
- United Arab Emirates
- Saudi Arabia
- South Africa
- Nigeria
- Rest of Middle East and Africa
- North America
Geography Analysis
North America dominated the financial advisory services market with 39.95% market share in 2025. Mature capital markets, deep wealth pools, and a rigorous yet stable regulatory environment allow advisers to price complex planning services at premium levels. New York, Chicago, and San Francisco remain command centers, housing JPMorgan Chase, Goldman Sachs, and Morgan Stanley, each managing multi-trillion-dollar books. Canadian institutions buttress regional heft; the proposed merger of Prospera, Coast Capital, and Sunshine Coast credit unions would create a purpose-driven co-operative overseeing USD 38.6 billion in assets, signaling consolidation momentum.
Asia-Pacific is projected to be the fastest-growing region, set to log an 7.78% CAGR to 2031. Rising middle-class affluence, digital-bank innovation, and progressive regulatory sandboxes cultivate fertile ground for adviser expansion. Japan's SBI Holdings and SMBC Group will debut "Olive Infinite" in 2026, pairing algorithmic allocation with live consultants. Taiwan chose Kaohsiung as the pilot hub for an Asian asset-management centre aimed at channeling more than TWD 30 trillion into professional portfolios. Chinese and Indian fintechs continue to onboard millions of first-time investors, giving rise to regional robo leaders.
Europe contributes a sizable revenue base anchored by London, Frankfurt, and Zurich, though economic uncertainty and dense regulation temper growth. Sweden transposed the EU Corporate Sustainability Reporting Directive into national law in 2024, expanding demand for ESG audit and advisory. Brexit realignment imposes additional licensing costs and data-transfer complexities that advisers must absorb to serve continental clients from UK hubs. Meanwhile, GCC wealth centers in the Middle East recruit global advisers to steward diversified sovereign portfolios, yet political volatility in parts of Africa restrains broader regional penetration.
- Bank of America Corporation
- Goldman Sachs Group Inc.
- Morgan Stanley
- Deloitte
- Ernst & Young (EY)
- JPMorgan Chase & Co.
- KPMG
- PwC
- Charles Schwab Corporation
- Wells Fargo & Co.
- Citigroup Inc.
- UBS Group AG
- Edward Jones
- Raymond James Financial Inc.
- Ameriprise Financial Inc.
- LPL Financial Holdings Inc.
- Stifel Financial Corp.
- RBC Wealth Management
- Betterment LLC
- Wealthfront Corporation
Additional Benefits:
- The market estimate (ME) sheet in Excel format
- 3 months of analyst support
TABLE OF CONTENTS
1 Introduction
- 1.1 Study Assumptions & Market Definition
- 1.2 Scope of the Study
2 Research Methodology
3 Executive Summary
4 Market Landscape
- 4.1 Market Overview
- 4.2 Market Drivers
- 4.2.1 AI-enabled hyper-personalised advice uptake
- 4.2.2 Shift from commission to fee-based models
- 4.2.3 Democratisation via low-cost robo-platforms
- 4.2.4 Generational wealth transfer to digital-savvy heirs
- 4.2.5 Reg-tech lowering compliance burden for mid-tier firms
- 4.2.6 Sovereign wealth funds outsourcing complex mandates
- 4.3 Market Restraints
- 4.3.1 Advisor talent shortage & ageing workforce
- 4.3.2 Margin compression from passive investing wave
- 4.3.3 Cyber-security & data-privacy liabilities
- 4.3.4 ESG-greenwashing litigations
- 4.4 Value / Supply-Chain Analysis
- 4.5 Regulatory Landscape
- 4.6 Technological Outlook
- 4.7 Porter's Five Forces
- 4.7.1 Bargaining Power of Buyers
- 4.7.2 Bargaining Power of Suppliers
- 4.7.3 Threat of New Entrants
- 4.7.4 Threat of Substitutes
- 4.7.5 Intensity of Competitive Rivalry
5 Market Size & Growth Forecasts (Value)
- 5.1 By Service Type
- 5.1.1 Corporate Finance
- 5.1.2 Accounting And Tax Advisory
- 5.1.3 Investment
- 5.1.4 Other Services
- 5.2 By Organization Size
- 5.2.1 Large Enterprises
- 5.2.2 Small & Medium-sized Enterprises (SMEs)
- 5.3 By Industry Vertical
- 5.3.1 Banking, Financial Services, Insurance (BFSI)
- 5.3.2 IT & Telecommunication
- 5.3.3 Manufacturing
- 5.3.4 Retail And E-Commerce
- 5.3.5 Public Sector
- 5.3.6 Healthcare And Pharmaceuticals
- 5.3.7 Other Industry Verticals
- 5.4 By Service Channel
- 5.4.1 Human Advisory
- 5.4.2 Hybrid Advisory
- 5.4.3 Robo-Advisory
- 5.5 By Delivery Mode
- 5.5.1 On-site Consulting
- 5.5.2 Remote / Virtual Consulting
- 5.6 By Region
- 5.6.1 North America
- 5.6.1.1 United States
- 5.6.1.2 Canada
- 5.6.1.3 Mexico
- 5.6.2 South America
- 5.6.2.1 Brazil
- 5.6.2.2 Argentina
- 5.6.2.3 Chile
- 5.6.2.4 Peru
- 5.6.2.5 Rest of South America
- 5.6.3 Europe
- 5.6.3.1 United Kingdom
- 5.6.3.2 Germany
- 5.6.3.3 France
- 5.6.3.4 Spain
- 5.6.3.5 Italy
- 5.6.3.6 Benelux (Belgium, Netherlands, and Luxembourg)
- 5.6.3.7 Nordics (Sweden, Norway, Denmark, Finland, and Iceland)
- 5.6.3.8 Rest of Europe
- 5.6.4 Asia Pacific
- 5.6.4.1 China
- 5.6.4.2 India
- 5.6.4.3 Japan
- 5.6.4.4 South Korea
- 5.6.4.5 Australia
- 5.6.4.6 South-East Asia (Singapore, Indonesia, Malaysia, Thailand, Vietnam, and Philippines)
- 5.6.4.7 Rest of Asia-Pacific
- 5.6.5 Middle East and Africa
- 5.6.5.1 United Arab Emirates
- 5.6.5.2 Saudi Arabia
- 5.6.5.3 South Africa
- 5.6.5.4 Nigeria
- 5.6.5.5 Rest of Middle East and Africa
- 5.6.1 North America
6 Competitive Landscape
- 6.1 Market Concentration
- 6.2 Strategic Moves
- 6.3 Market Share Analysis
- 6.4 Company Profiles (includes Global Level Overview, Market Level Overview, Core Segments, Financials as available, Strategic Information, Market Rank/Share for Key Companies, Products & Services, and Recent Developments)
- 6.4.1 Bank of America Corporation
- 6.4.2 Goldman Sachs Group Inc.
- 6.4.3 Morgan Stanley
- 6.4.4 Deloitte
- 6.4.5 Ernst & Young (EY)
- 6.4.6 JPMorgan Chase & Co.
- 6.4.7 KPMG
- 6.4.8 PwC
- 6.4.9 Charles Schwab Corporation
- 6.4.10 Wells Fargo & Co.
- 6.4.11 Citigroup Inc.
- 6.4.12 UBS Group AG
- 6.4.13 Edward Jones
- 6.4.14 Raymond James Financial Inc.
- 6.4.15 Ameriprise Financial Inc.
- 6.4.16 LPL Financial Holdings Inc.
- 6.4.17 Stifel Financial Corp.
- 6.4.18 RBC Wealth Management
- 6.4.19 Betterment LLC
- 6.4.20 Wealthfront Corporation
7 Market Opportunities & Future Outlook
- 7.1 White-space & Unmet-need Assessment

