PUBLISHER: Mordor Intelligence | PRODUCT CODE: 2120419

PUBLISHER: Mordor Intelligence | PRODUCT CODE: 2120419
Talc - Market Share Analysis, Industry Trends & Statistics, Growth Forecasts (2026 - 2031)
According to Mordor Intelligence, the talc market size is expected to grow from 8.44 Million tons in 2025 to 8.80 Million tons in 2026 and is forecast to reach 10.87 Million tons by 2031 at 4.31% CAGR over 2026-2031.
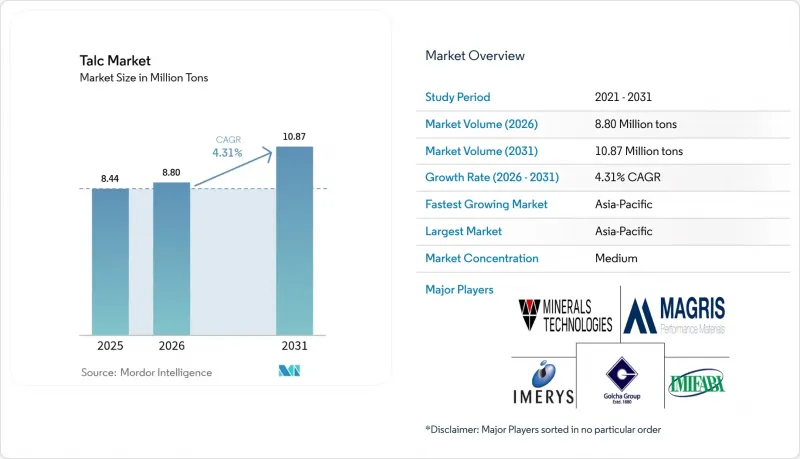
This report is Segmented by Deposit Type (Talc Carbonate and Talc Chlorite), End-User Industry (Plastics and Rubber, Paints and Coatings, Ceramics, Pulp and Paper, Personal Care and Cosmetics, Food and Beverage, and Other Industries), and Geography (Asia-Pacific, North America, Europe, South America, and Middle-East and Africa). The Market Forecasts are Provided in Terms of Volume (Tons).
Global Talc Market Trends and Insights
Robust PP and TPO Adoption in Automotive Lightweighting
Automakers embed 15%-25% talc in PP and TPO compounds to achieve stiffness-to-weight ratios that meet fuel-economy and EV-range mandates without retooling injection lines. Imerys opened a EUR 43 million facility in Wuhu in 2025 to supply 30,000 tons of ultra-fine grades targeted at battery housings and interior panels. The OECD projects plastics use in Southeast and East Asia to rise from 60 million tons in 2019 to 150 million tons by 2060, with automotive and electronics driving the steepest slopes. Malaysia's circular-economy initiative recovered 12,000 tons of PP and ABS from end-of-life vehicles in 2024, a figure expected to triple by 2030. Talc's nucleating effect shortens molding cycles by 8%-12%, raising throughput for tier-one suppliers operating at 85%-90% capacity utilization.
Growing Shift to Water-Based Architectural Paints in Asia
China's GB30981.1-2025 caps VOCs at 80 g/L for interior coatings, forcing formulators to adopt aqueous binders that require higher talc loadings. India's Bureau of Indian Standards is drafting similar limits for notification in late 2026. Water-based systems typically contain 12%-18% talc, up from 8%-12% in solvent-borne paints, because the mineral's lamellar platelets compensate for lower hiding power. Thailand's Office of Industrial Economics recorded a 17.27% rise in domestic talc output in 2024, with exports up 14.73% on demand from Vietnam, Indonesia, and the Philippines. Compared with titanium dioxide, talc is priced at USD 150-250 per ton, enabling paint makers to hold shelf prices steady despite inflation in other additives.
Persistent Asbestos-Related Litigation Costs
Johnson & Johnson offered USD 10 billion in May 2024 to settle 62,000 ovarian-cancer claims tied to cosmetic talc. The proposal remains in limbo after successive Chapter 11 filings by LTL Management were dismissed, prolonging uncertainty for upstream miners. Minerals Technologies booked a USD 215 million provision in Q1 2025 to fund a trust for 684 open cases, after divesting Barretts Minerals for USD 32 million. Imerys obtained 90% creditor approval in January 2025 for its North American restructuring, ring-fencing legacy liabilities but constraining balance-sheet flexibility. Insurance premiums on talc producers' primary layers rose 40%-60% in 2025, while aggregate limits tightened to USD 50-100 million, compelling mid-tier players to self-insure or exit cosmetic grades.
Other drivers and restraints analyzed in the detailed report include:
- Strong Demand for Talc-Filled Polymer Masterbatch in Packaging
- Expansion of Ceramics Production in South and Southeast Asia
- Bio-Based Fillers Replacing Talc in Premium Papers
For complete list of drivers and restraints, kindly check the Table Of Contents.
Segment Analysis
Talc carbonate accounted for 61.90% of 2025 tonnage, thanks to abundant metamorphic belts in China, India, and Brazil that yield cost-effective ore for plastics, paints, and ceramics. Talc Chlorite, holding the balance, will expand at a 4.76% CAGR as automotive and electronics customers impose sub-50 ppm iron limits impossible for many carbonate ores. Chlorite talc delivers less than 0.05% iron versus 0.15%-0.30% for carbonate, eliminating color shift in white automotive trim and cutting bleaching costs in cosmetic formulations. Chlorite grades fetch a USD 50-100 premium but reduce kiln CO2 evolution by 8%-12%, aiding EU carbon-pricing compliance. Finnish labor strikes in 2024 sidelined 40,000-50,000 t/y, forcing buyers to pre-book 60%-70% of annual needs under fixed-price contracts, a structural move that reshapes the talc market share at the value-added end of the spectrum.
Stockpiling by Japanese and South Korean electronics firms illustrates tightness: importers doubled safety inventories to 45 days in 2025, up from 22 days pre-strike, insulating supply chains yet locking in working capital. Indian processors eye Western Australia's chlorite veins to diversify sourcing and hedge currency exposure. Carbonate ore remains indispensable for construction fillers and rubber, where price outweighs purity.
Complete Report Scope:
- By Deposit Type
- Talc Carbonate
- Talc Chlorite
- By End-user Industry
- Plastics and Rubber
- Paints and Coatings
- Ceramics
- Pulp and Paper
- Personal Care and Cosmetics
- Food and Beverage
- Other End-user Industries
- By Geography
- Asia-Pacific
- China
- India
- Japan
- South Korea
- ASEAN Countries
- Rest of Asia-Pacific
- North America
- United States
- Canada
- Mexico
- Europe
- Germany
- United Kingdom
- France
- Italy
- NORDIC Countries
- Rest of Europe
- South America
- Brazil
- Argentina
- Rest of South America
- Middle-East and Africa
- Saudi Arabia
- South Africa
- Rest of Middle-East and Africa
- Asia-Pacific
Geography Analysis
Asia-Pacific's 53.22% slice in 2025 and a 5.18% forecast CAGR rely on synchronized forces. India's ceramic sector generated INR 51,000-53,000 crore (USD 6.1-6.4 billion) in FY 2025, underpinned by 6%-7% domestic tile demand and 25.4 million m2 of announced capacity. Vietnam's tile exports jumped 22% in 2024 after anti-dumping rulings against Chinese products, spurring investment in roller-kiln retrofits that demand finer talc to avert warping. China's GB30981.1-2025 VOC cap forces formulators to raise talc in water-based paints by 30%-40%. Thailand's 17.27% rise in 2024 output reflects its role as an ASEAN processing hub. OECD long-range models see regional plastics demand tripling to 150 million tons by 2060, locking talc into the lightweighting narrative. Japan and South Korea specialize in chlorite-grade imports for electronics and pharma, where sub-ppm heavy-metal limits create high barriers to entry.
North America's growth is restricted owing to litigation and producer exits. Minerals Technologies' April 2024 sale of Barretts Minerals for USD 32 million underscores the squeeze between liability risk and operating returns. Johnson & Johnson's unresolved USD 10 billion proposal magnifies insurance costs, adding 40%-60% to premiums. U.S. mines in Montana and Vermont still supply automotive and paints customers, but new permits evolve slowly amid public scrutiny. In Canada and Mexico, primarily in auto plastics, covered by USMCA rules favouring local content. The FDA's 2024 microscopy mandate raises batch-testing costs, nudging niche cosmetics brands toward starch alternatives.
Europe is curbed by bio-based substitution in premium paper and the March 2025 bankruptcy of Imerys Talc Italy. Nordic chlorite operations feed pharmaceutical and food-contact markets, strike, tighten spot supply, and drive buyers to commit 60%-70% of annual needs under take-or-pay terms. Germany, France, the UK, and Italy's consumption spans automotive, architectural paints, and ceramics. The EU's forthcoming Ecodesign Regulation, which will require material passports from 2028, favors fillers with transparent provenance and lower life-cycle carbon, putting cost pressure on energy-intensive talc producers. South America and the Middle-East and Africa together take a smaller share, led by Brazil's auto plastics and Saudi Arabia's nascent ceramics clusters, though currency swings and logistics bottlenecks limit velocity.
- AKJ MinChem
- ANAND TALC
- Chanda Minerals
- CIMBAR PERFORMANCE MINERALS
- euroMinerals GmbH
- Golcha Group
- Hayashi-Kasei
- Imerys
- IMI Fabi SpA
- LITHOS Industrial Minerals GmbH
- Magris Performance Materials
- Minerals Technologies Inc.
- Nippon Talc Co., Ltd.
- Sibelco
Additional Benefits:
- The market estimate (ME) sheet in Excel format
- 3 months of analyst support
TABLE OF CONTENTS
1 Introduction
- 1.1 Study Assumptions and Market Definition
- 1.2 Scope of the Study
2 Research Methodology
3 Executive Summary
4 Market Landscape
- 4.1 Market Overview
- 4.2 Market Drivers
- 4.2.1 Robust PP and TPO Adoption in Automotive Lightweighting
- 4.2.2 Growing Shift to Water-Based Architectural Paints in Asia
- 4.2.3 Strong Demand for Talc-Filled Polymer Masterbatch in Packaging
- 4.2.4 Expansion of Ceramics Production in South and Southeast Asia
- 4.2.5 AI-Enabled Ore-Sorting Boosting Ore Recovery and Unit Economics
- 4.3 Market Restraints
- 4.3.1 Persistent Asbestos-Related Litigation Costs
- 4.3.2 Bio-Based Fillers Replacing Talc in Premium Papers
- 4.3.3 High-Purity Ore Shortages in Europe After Finnish Labor Strike
- 4.4 Value Chain Analysis
- 4.5 Porter's Five Forces
- 4.5.1 Bargaining Power of Suppliers
- 4.5.2 Bargaining Power of Consumers
- 4.5.3 Threat of New Entrants
- 4.5.4 Threat of Substitutes
- 4.5.5 Degree of Competition
5 Market Size and Growth Forecasts (Volume)
- 5.1 By Deposit Type
- 5.1.1 Talc Carbonate
- 5.1.2 Talc Chlorite
- 5.2 By End-user Industry
- 5.2.1 Plastics and Rubber
- 5.2.2 Paints and Coatings
- 5.2.3 Ceramics
- 5.2.4 Pulp and Paper
- 5.2.5 Personal Care and Cosmetics
- 5.2.6 Food and Beverage
- 5.2.7 Other End-user Industries
- 5.3 By Geography
- 5.3.1 Asia-Pacific
- 5.3.1.1 China
- 5.3.1.2 India
- 5.3.1.3 Japan
- 5.3.1.4 South Korea
- 5.3.1.5 ASEAN Countries
- 5.3.1.6 Rest of Asia-Pacific
- 5.3.2 North America
- 5.3.2.1 United States
- 5.3.2.2 Canada
- 5.3.2.3 Mexico
- 5.3.3 Europe
- 5.3.3.1 Germany
- 5.3.3.2 United Kingdom
- 5.3.3.3 France
- 5.3.3.4 Italy
- 5.3.3.5 NORDIC Countries
- 5.3.3.6 Rest of Europe
- 5.3.4 South America
- 5.3.4.1 Brazil
- 5.3.4.2 Argentina
- 5.3.4.3 Rest of South America
- 5.3.5 Middle-East and Africa
- 5.3.5.1 Saudi Arabia
- 5.3.5.2 South Africa
- 5.3.5.3 Rest of Middle-East and Africa
- 5.3.1 Asia-Pacific
6 Competitive Landscape
- 6.1 Market Concentration
- 6.2 Strategic Moves
- 6.3 Market Share (%)/Ranking Analysis
- 6.4 Company Profiles (includes Global level Overview, Market level overview, Core Segments, Financials as available, Strategic Information, Products and Services, Recent Developments)
- 6.4.1 AKJ MinChem
- 6.4.2 ANAND TALC
- 6.4.3 Chanda Minerals
- 6.4.4 CIMBAR PERFORMANCE MINERALS
- 6.4.5 euroMinerals GmbH
- 6.4.6 Golcha Group
- 6.4.7 Hayashi-Kasei
- 6.4.8 Imerys
- 6.4.9 IMI Fabi SpA
- 6.4.10 LITHOS Industrial Minerals GmbH
- 6.4.11 Magris Performance Materials
- 6.4.12 Minerals Technologies Inc.
- 6.4.13 Nippon Talc Co., Ltd.
- 6.4.14 Sibelco
7 Market Opportunities and Future Outlook
- 7.1 White-space and Unmet-Need Assessment

