PUBLISHER: Mordor Intelligence | PRODUCT CODE: 2124120

PUBLISHER: Mordor Intelligence | PRODUCT CODE: 2124120
Pyrophyllite - Market Share Analysis, Industry Trends & Statistics, Growth Forecasts (2026 - 2031)
According to Mordor Intelligence, the pyrophyllite market size is expected to increase from 786.22 kilotons in 2025 to 802.81 kilotons in 2026 and reach 891.16 kilotons by 2031, growing at a CAGR of 2.11% over 2026-2031.
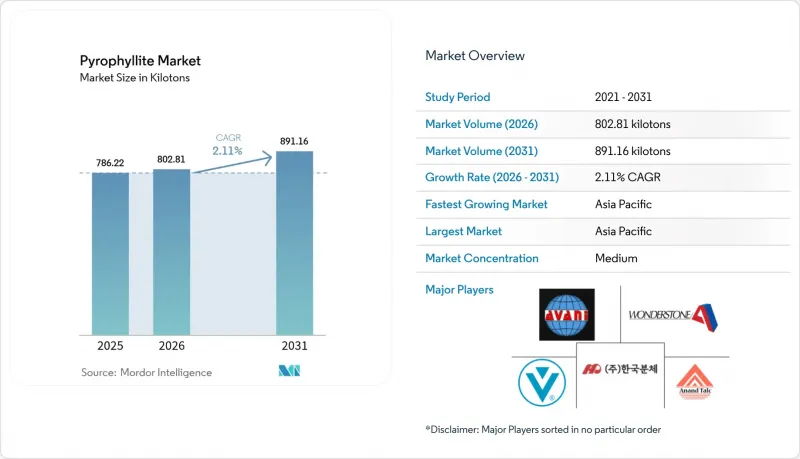
This report is Segmented by Type (Natural Pyrophyllite and Other Types), Application (Ceramics, Refractory, Filler Materials, Fiberglass, Rubber and Roofing, Fertilizers, Ornamental Stones, and Other Applications), and Geography (Asia-Pacific, North America, Europe, South America, and Middle East and Africa). Market Forecasts are Provided in Terms of Volume (Tons).
Global Pyrophyllite Market Trends and Insights
Rising Refractory Demand in Electric-Arc Steelmaking
Electric-arc furnaces displace blast-oxygen routes because they cut direct CO2 emissions and accept 100% scrap feedstocks. Every heat subjects refractories to 1,600 °C thermal shock, so tap-hole, ladle, and launder bricks increasingly rely on pyrophyllite binders that exhibit very low thermal expansion, excellent slag resistance, and stable alumina-silica networks. Global EAF capital spending rose from USD 670 million in 2024 and is slated to hit USD 1.27 billion by 2032 at an 11% CAGR, which feeds directly into refractory-grade pyrophyllite absorption. RHI Magnesita's USD 1 billion acquisition spree locks in ore supply for this wave, while any Chinese export restriction on magnesite would widen the application window for alumina-silicate alternatives.
Lightweight Mineral Fillers for High-Build Industrial Coatings
Offshore wind-turbine towers, LNG tanks, and marine structures need thick coatings that resist corrosion without adding mass. Pyrophyllite's platy habit and 1.58 refractive index deliver hiding power equivalent to talc at lower loading, enabling 400-600 μm dry-film thickness in one pass. North American and European formulators also substitute the mineral for titanium dioxide after 2024's 40% TiO2 price spike. Fiberglass manufacturers mix pyrophyllite into E-glass batches to lower the melting temperature by 30-50 °C, which trims natural-gas use and aligns with decarbonization goals. These factors add 0.3 percentage points to the forecast CAGR, mainly in 2026-2028, while paint lines qualify new masterbatches.
Abundant Substitute Minerals: Talc, Kaolin, Feldspar
Talc, kaolin, and feldspar serve roughly 80% of the same end uses and benefit from multi-million-ton economies of scale. Kaolin sales should climb from USD 4.85 billion in 2024 to USD 6.67 billion by 2030, bolstered by low-cost mining in Georgia, Cornwall, and Jiangsu. Talc continues as the default filler for polymers and paper, while feldspar remains the cheapest ceramic flux. These options shave 0.4 percentage points off pyrophyllite's CAGR as buyers substitute whenever performance requirements allow.
Other drivers and restraints analyzed in the detailed report include:
- Shift from Talc to Pyrophyllite in Cosmetics Amid Asbestos Litigation
- Solid-State Battery Ceramic Separators Needing High-Purity Al-Si Feedstocks
- Scarcity of Low-Iron, High-Al2O3 Ore Bodies
For complete list of drivers and restraints, kindly check the Table Of Contents.
Segment Analysis
Natural grades supplied 86.65% of 2025 tonnage, yet beneficiated and synthetic options are logging a 2.71% expansion through 2031. Natural feedstocks from Kings Mountain and Ottosdal sell at USD 200-350 per ton for ceramics, refractories, and filler uses, while battery and cosmetics buyers demand concentrates leached to <0.05% Fe2O3 that fetch USD 800-1,200. QuantumScape specifies +-0.02% tolerance on alumina, achievable only by flotation plus acid-leach routes that straddle natural and synthetic classes.
Hybrid processing is redefining product taxonomy. North Carolina producers are adding magnetic separation before calcination, while Japanese traders surface-treat powders with silanes for cosmetics. This migration shifts revenue even if natural ore retains volume leadership. The pyrophyllite market reports that synthetics can command three to five times natural pricing, supporting processors' capital spending on leach and calcine assets.
Complete Report Scope:
- By Type
- Natural Pyrophyllite
- Other Types
- By Application
- Ceramics
- Refractory
- Filler Materials (Paper, Paints, Insecticides)
- Fiberglass
- Rubber and Roofing
- Fertilizers (Soil Conditioners)
- Ornamental Stones
- Other Applications
- By Geography
- Asia-Pacific
- China
- India
- Japan
- South Korea
- Malaysia
- Thailand
- Indonesia
- Vietnam
- Rest of Asia-Pacific
- North America
- United States
- Canada
- Mexico
- Europe
- Germany
- United Kingdom
- France
- Italy
- Spain
- Nordic Countries
- Turkey
- Russia
- Rest of Europe
- South America
- Brazil
- Argentina
- Colombia
- Rest of South America
- Middle-East and Africa
- Saudi Arabia
- United Arab Emirates
- Qatar
- Egypt
- Nigeria
- South Africa
- Rest of Middle-East and Africa
- Asia-Pacific
Geography Analysis
Asia-Pacific possessed 75.62% of 2025 consumption and will advance at 2.78% to 2031. China's coupled mining-refractory ecosystem in Liaoning underpins most of that demand, and India's ceramics and filler sectors add further pull. Japan and South Korea import low-iron North Carolina concentrates at USD 600-900 per ton for advanced ceramics and separator research and development.
North America accounted for a significant market share in 2025 as two North Carolina operations feed U.S. steelmakers and coatings formulators. Inflation Reduction Act incentives should lift domestic EAF steel output 15-20% by 2030, nudging regional pyrophyllite uptake. Europe is witnessing moderate market growth, with Germany's and Sweden's hydrogen-furnace pilots sparking new low-alkali refractory demand. Southern Europe retains ceramics customers in Italy and Spain, while Nordic offshore-wind investments push coating fillers.
South America, plus the Middle East and Africa, are witnessing an expansion of the market. South African production goes mostly to export markets, but rail and energy constraints cap quantum. Any Chinese export quota, similar to the 2010 rare-earth move, would reroute buyers toward North Carolina and South Africa. Given permitting lags, Asia-Pacific is unlikely to drop below 70% share by 2031.
- Anand Talc
- Avani Group
- Hankook Mineral Powder Co. Ltd.
- Hebei Yayang Spodumene Co., Ltd.
- Idwala Industrial Holdings
- Jinhae Pyrophyllite
- Liaoyuan Pharmaceutical Co., Ltd.
- NINGBO INNO PHARMCHEM CO., LTD.
- PT Gunung Bale
- R.T. Vanderbilt Holding Company, Inc.
- RHI Magnesita
- SAMIROCK Company
- SEPRA
- SKKU Minerals
- Wonderstone
Additional Benefits:
- The market estimate (ME) sheet in Excel format
- 3 months of analyst support
TABLE OF CONTENTS
1 Introduction
- 1.1 Study Assumptions and Market Definition
- 1.2 Scope of the Study
2 Research Methodology
3 Executive Summary
4 Market Landscape
- 4.1 Market Overview
- 4.2 Market Drivers
- 4.2.1 Rising refractory demand in electric-arc steelmaking
- 4.2.2 Light-weight mineral fillers for high-build industrial coatings
- 4.2.3 Shift from talc to pyrophyllite in cosmetics amid asbestos litigation
- 4.2.4 Solid-state-battery ceramic separators needing high-purity Al-Si feedstocks
- 4.2.5 Low-alkali grades enabling hydrogen furnace refractories
- 4.3 Market Restraints
- 4.3.1 Abundant substitute minerals: talc, kaolin, feldspar
- 4.3.2 Scarcity of low-iron, high-Al2O3 ore bodies
- 4.3.3 High-energy intensity of fine-grinding and flotation circuit upgrades
- 4.4 Value Chain Analysis
- 4.5 Porter's Five Forces
- 4.5.1 Threat of New Entrants
- 4.5.2 Bargaining Power of Buyers
- 4.5.3 Bargaining Power of Suppliers
- 4.5.4 Threat of Substitute Products
- 4.5.5 Degree of Competition
5 Market Size and Growth Forecasts (Volume)
- 5.1 By Type
- 5.1.1 Natural Pyrophyllite
- 5.1.2 Other Types
- 5.2 By Application
- 5.2.1 Ceramics
- 5.2.2 Refractory
- 5.2.3 Filler Materials (Paper, Paints, Insecticides)
- 5.2.4 Fiberglass
- 5.2.5 Rubber and Roofing
- 5.2.6 Fertilizers (Soil Conditioners)
- 5.2.7 Ornamental Stones
- 5.2.8 Other Applications
- 5.3 By Geography
- 5.3.1 Asia-Pacific
- 5.3.1.1 China
- 5.3.1.2 India
- 5.3.1.3 Japan
- 5.3.1.4 South Korea
- 5.3.1.5 Malaysia
- 5.3.1.6 Thailand
- 5.3.1.7 Indonesia
- 5.3.1.8 Vietnam
- 5.3.1.9 Rest of Asia-Pacific
- 5.3.2 North America
- 5.3.2.1 United States
- 5.3.2.2 Canada
- 5.3.2.3 Mexico
- 5.3.3 Europe
- 5.3.3.1 Germany
- 5.3.3.2 United Kingdom
- 5.3.3.3 France
- 5.3.3.4 Italy
- 5.3.3.5 Spain
- 5.3.3.6 Nordic Countries
- 5.3.3.7 Turkey
- 5.3.3.8 Russia
- 5.3.3.9 Rest of Europe
- 5.3.4 South America
- 5.3.4.1 Brazil
- 5.3.4.2 Argentina
- 5.3.4.3 Colombia
- 5.3.4.4 Rest of South America
- 5.3.5 Middle-East and Africa
- 5.3.5.1 Saudi Arabia
- 5.3.5.2 United Arab Emirates
- 5.3.5.3 Qatar
- 5.3.5.4 Egypt
- 5.3.5.5 Nigeria
- 5.3.5.6 South Africa
- 5.3.5.7 Rest of Middle-East and Africa
- 5.3.1 Asia-Pacific
6 Competitive Landscape
- 6.1 Market Concentration
- 6.2 Strategic Moves
- 6.3 Market Share(%)/Ranking Analysis
- 6.4 Company Profiles (includes Global Overview, Market Overview, Core Segments, Financials, Strategic Information, Products and Services, Recent Developments)
- 6.4.1 Anand Talc
- 6.4.2 Avani Group
- 6.4.3 Hankook Mineral Powder Co. Ltd.
- 6.4.4 Hebei Yayang Spodumene Co., Ltd.
- 6.4.5 Idwala Industrial Holdings
- 6.4.6 Jinhae Pyrophyllite
- 6.4.7 Liaoyuan Pharmaceutical Co., Ltd.
- 6.4.8 NINGBO INNO PHARMCHEM CO., LTD.
- 6.4.9 PT Gunung Bale
- 6.4.10 R.T. Vanderbilt Holding Company, Inc.
- 6.4.11 RHI Magnesita
- 6.4.12 SAMIROCK Company
- 6.4.13 SEPRA
- 6.4.14 SKKU Minerals
- 6.4.15 Wonderstone
7 Market Opportunities and Future Outlook
- 7.1 White-space and Unmet-need Assessment

