PUBLISHER: Mordor Intelligence | PRODUCT CODE: 2120521

PUBLISHER: Mordor Intelligence | PRODUCT CODE: 2120521
Oilfield Chemicals - Market Share Analysis, Industry Trends & Statistics, Growth Forecasts (2026 - 2031)
According to Mordor Intelligence, the oilfield chemicals market size is expected to increase from USD 28.96 billion in 2025 to USD 29.95 billion in 2026 and reach USD 35.41 billion by 2031, growing at a CAGR of 3.41% over 2026-2031.
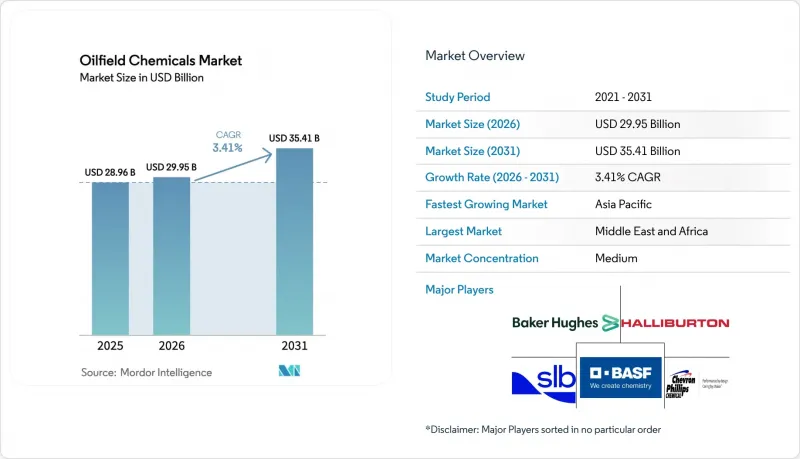
This report is Segmented by Chemical Type (Biocides, Corrosion Inhibitors, Demulsifiers, Polymers, Surfactants, and More), Application (Drilling and Cementing, Production, Well Stimulation, Enhanced Oil Recovery, and Workover and Completion), and Geography (Asia-Pacific, North America, Europe, South America, Middle East and Africa). The Market Forecasts are Provided in Terms of Value (USD).
Global Oilfield Chemicals Market Trends and Insights
Increased Shale Gas Exploration And Production
Record dry-gas volumes from the Marcellus and Haynesville basins sustained high usage of friction reducers, clay stabilizers, and biocides in 2025. Operators continue to extend lateral lengths, increasing stage counts and raising total chemical consumption per well even as dosage efficiencies improve. Argentina's Vaca Muerta attracted more than USD 5 billion in upstream capital during 2024-2025, with custom slickwater systems formulated for the play's high-temperature, high-clay profile. China's push to commercialize Sichuan Basin shale faces water scarcity, so producers are trialing foamed and waterless fracturing fluids that cut freshwater requirements by up to 70%. Shale growth in these three regions alone underpins a sizable tranche of the oilfield chemicals market, even though per-barrel chemical intensity continues to decline in mature North American plays.
Rising Demand For Petroleum-Based Fuels From Transportation
Global liquids demand remains resilient because aviation, shipping, and long-haul trucking lack cost-competitive battery alternatives. Petrochemical integration projects in India pull additional crude volumes that require reliable flow-assurance chemistries well beyond first oil. National oil companies in the Middle East protect low-cost barrels, ensuring a steady call on production chemicals for corrosion, scale, and emulsion control. Even in electrifying regions, legacy fleets still anchor diesel and jet fuel demand, sustaining the oilfield chemicals market in legacy and incremental wells alike. As a result, production chemical spending grows in line with base-decline management, helping operators hold plateau rates through chemical intervention rather than fresh drilling.
Global Shift Toward Clean Energy And Electrification
Shell has capped oil output at 2024 levels and redirects USD 15 billion each year toward low-carbon ventures. BP plans a 25% reduction in hydrocarbon production by 2030, a move that trims drilling budgets and, by extension, chemical demand. TotalEnergies earmarks 40% of capital for renewables, limiting funds for green-field wells that historically pull large volumes of stimulation chemicals. The International Energy Agency's Net Zero scenario projects falling upstream investment beyond 2025, a structural headwind for the oilfield chemicals market. While production chemicals remain essential for existing wells, the growth ceiling is lower when fewer new wells enter the mix.
Other drivers and restraints analyzed in the detailed report include:
- Expansion Of Deep- And Ultra-Deep-Water Projects Needing Advanced Chemistries
- Growth In CO2-EOR And CCUS Projects Requiring Compatible Chemicals
- Crude-Price Volatility Curbing Upstream Investment
For complete list of drivers and restraints, kindly check the Table Of Contents.
Segment Analysis
Corrosion inhibitors retained 33.56% of 2025 revenue, confirming that asset-integrity chemistries remain the largest slice of the oilfield chemicals market. This dominance is linked to higher water cut and acid gas content in aging assets, conditions that corrode tubulars and threaten unplanned outages. In contrast, bio-based surfactants are projected to grow at a 4.82% CAGR, the fastest pace within the portfolio, as sustainability covenants tighten, coupled with financiers rewarding environmentally preferred formulations. The oilfield chemicals market size for polymers has plateaued because operators recycle more flowback water, reducing required viscosifier loads per stage, yet polymer innovation around nanocomposite additives aims to restore growth through higher efficiency at lower dosage.
Demulsifiers are indispensable in offshore production, where crew changes and rough weather can require chemicals that maintain 95% separation efficiency without intervention. Scale, paraffin, and asphaltene inhibitors protect long tiebacks in Brazilian and West African deepwater, making them a stable subsegment even if volume growth lags high-profile categories. Nanotechnology-enhanced corrosion inhibitors have shown field results of 20% lower dosage yet improved film density, indicating room for margin expansion as these products scale. Altogether, chemical-type diversification helps suppliers cushion revenue against cyclical drilling downturns while preserving the oilfield chemicals market share lead enjoyed by corrosion-control products.
Complete Report Scope:
- By Chemical Type
- Biocides
- Corrosion Inhibitors
- Demulsifiers
- Polymers
- Surfactants
- Other Chemical Types (Scale Inhibitors, Paraffin and Asphaltene Inhibitors, etc.)
- By Application
- Drilling and Cementing
- Production (Flow Assurance and Asset Integrity)
- Well Stimulation
- Enhanced Oil Recovery
- Workover and Completion
- By Geography
- Asia-Pacifc
- China
- India
- Japan
- South Korea
- ASEAN Countries
- Rest of Asia-Pacific
- North America
- United States
- Canada
- Mexico
- Europe
- Germany
- United Kingdom
- France
- Italy
- Russia
- NORDIC Countries
- Rest of Europe
- South America
- Brazil
- Argentina
- Rest of South America
- Middle East and Africa
- Saudi Arabia
- United Arab Emirates
- Iran
- Iraq
- South Africa
- Algeria
- Nigeria
- Rest of Middle East and Africa
- Asia-Pacifc
Geography Analysis
Middle East and Africa commanded 28.36% of global demand in 2025, anchored by Saudi Aramco's Jafurah gas program and ADNOC's sour-gas projects that require corrosion-resistant and hydrogen-sulfide-scavenging formulations. Kuwait and Iraq expand water-floods that push water cut above 80%, elevating demand for scale inhibitors and demulsifiers. Deepwater Nigeria and Angola developments rely on subsea injection systems and long-residence inhibitors to manage wax and hydrate risks in 40-kilometer tiebacks. The oilfield chemicals market size in the region will keep momentum as national oil companies protect low lifting-cost assets and integrate digital dosing to hit sustainability targets.
Asia-Pacific is forecast to grow at a 4.94% CAGR through 2031, thanks to China's expanding polymer floods at Daqing and Jilin and India's deepwater drilling in the Krishna-Godavari Basin. Indonesia and Malaysia pursue marginal-field EOR that needs tailor-made chemicals for high-water-cut, high-salinity crudes. Japan, South Korea, and Thailand import specialty additives for offshore workovers, and Vietnam attracts frontier exploration that mandates bio-based drilling fluids in ecologically sensitive zones. These projects widen the customer base and bolster the oilfield chemicals market even as regional policy moves gradually toward lower-carbon energy.
North America remains pivotal because the United States maintains crude output above 5 million barrels per day in the Permian Basin, driving large offtake of friction reducers, biocides, and scale inhibitors. Canada's oil sands generate steady orders for demulsifiers and corrosion inhibitors suitable for cold-weather pipelines. Mexico's shallow-water redevelopment needs cost-effective stimulation chemicals, although fiscal constraints cap growth. Europe's North Sea faces declining production yet rising regulatory demands, pushing operators toward bio-based additives. Russia's sector remains significant but is constrained by sanctions that limit access to Western specialty chemicals, creating room for domestic equivalents. South America's growth continues to hinge on Brazil's pre-salt, which awards multiyear chemical supply contracts to integrated service companies. This geographic mosaic underpins diversification of revenue streams across the oilfield chemicals market.
- Albemarle Corporation
- Ashland
- Baker Hughes Company
- BASF
- CES Energy Solutions Corp.
- ChampionX
- Clariant
- Croda International plc
- Chevron Phillips Chemical Company LLC
- Dow
- Elementis plc
- Flotek Industries, Inc.
- Halliburton
- Huntsman International LLC
- Innospec Oilfield Services
- Kemira
- SNF Floerger
- MPRC
- Ecolab
- Nouryon
- SLB (Schlumberger Limited)
- Solvay
- The Lubrizol Corporation
- Weatherford
- Zirax
Additional Benefits:
- The market estimate (ME) sheet in Excel format
- 3 months of analyst support
TABLE OF CONTENTS
1 Introduction
- 1.1 Study Assumptions and Market Definition
- 1.2 Scope of the Study
2 Research Methodology
3 Executive Summary
4 Market Landscape
- 4.1 Market Overview
- 4.2 Market Drivers
- 4.2.1 Increased shale gas exploration and production
- 4.2.2 Rising demand for petroleum-based fuels from transportation
- 4.2.3 Expansion of deep- and ultra-deep-water projects needing advanced chemistries
- 4.2.4 Growth in CO2-EOR and CCUS projects requiring compatible chemicals
- 4.2.5 Bio-based, low-toxicity formulations tied to ESG-linked finance criteria
- 4.3 Market Restraints
- 4.3.1 Global shift toward clean energy and electrification
- 4.3.2 Crude-price volatility curbing upstream investment
- 4.3.3 PFAS / hazardous-chem regulation tightening and compliance cost rise
- 4.3.4 Raw-material (barite, bromine) supply shocks and pricing spikes
- 4.4 Value Chain Analysis
- 4.5 Regulatory Landscape
- 4.6 Technological Outlook
- 4.7 Porter's Five Forces
- 4.7.1 Bargaining Power of Suppliers
- 4.7.2 Bargaining Power of Buyers
- 4.7.3 Threat of New Entrants
- 4.7.4 Threat of Substitutes
- 4.7.5 Degree of Competition
5 Market Size and Growth Forecasts (Value)
- 5.1 By Chemical Type
- 5.1.1 Biocides
- 5.1.2 Corrosion Inhibitors
- 5.1.3 Demulsifiers
- 5.1.4 Polymers
- 5.1.5 Surfactants
- 5.1.6 Other Chemical Types (Scale Inhibitors, Paraffin and Asphaltene Inhibitors, etc.)
- 5.2 By Application
- 5.2.1 Drilling and Cementing
- 5.2.2 Production (Flow Assurance and Asset Integrity)
- 5.2.3 Well Stimulation
- 5.2.4 Enhanced Oil Recovery
- 5.2.5 Workover and Completion
- 5.3 By Geography
- 5.3.1 Asia-Pacifc
- 5.3.1.1 China
- 5.3.1.2 India
- 5.3.1.3 Japan
- 5.3.1.4 South Korea
- 5.3.1.5 ASEAN Countries
- 5.3.1.6 Rest of Asia-Pacific
- 5.3.2 North America
- 5.3.2.1 United States
- 5.3.2.2 Canada
- 5.3.2.3 Mexico
- 5.3.3 Europe
- 5.3.3.1 Germany
- 5.3.3.2 United Kingdom
- 5.3.3.3 France
- 5.3.3.4 Italy
- 5.3.3.5 Russia
- 5.3.3.6 NORDIC Countries
- 5.3.3.7 Rest of Europe
- 5.3.4 South America
- 5.3.4.1 Brazil
- 5.3.4.2 Argentina
- 5.3.4.3 Rest of South America
- 5.3.5 Middle East and Africa
- 5.3.5.1 Saudi Arabia
- 5.3.5.2 United Arab Emirates
- 5.3.5.3 Iran
- 5.3.5.4 Iraq
- 5.3.5.5 South Africa
- 5.3.5.6 Algeria
- 5.3.5.7 Nigeria
- 5.3.5.8 Rest of Middle East and Africa
- 5.3.1 Asia-Pacifc
6 Competitive Landscape
- 6.1 Market Concentration
- 6.2 Strategic Moves
- 6.3 Market Share(%)/Ranking Analysis
- 6.4 Company Profiles {(includes Global level Overview, Market level overview, Core Segments, Financials as available, Strategic Information, Market Rank/Share, Products and Services, Recent Developments)}
- 6.4.1 Albemarle Corporation
- 6.4.2 Ashland
- 6.4.3 Baker Hughes Company
- 6.4.4 BASF
- 6.4.5 CES Energy Solutions Corp.
- 6.4.6 ChampionX
- 6.4.7 Clariant
- 6.4.8 Croda International plc
- 6.4.9 Chevron Phillips Chemical Company LLC
- 6.4.10 Dow
- 6.4.11 Elementis plc
- 6.4.12 Flotek Industries, Inc.
- 6.4.13 Halliburton
- 6.4.14 Huntsman International LLC
- 6.4.15 Innospec Oilfield Services
- 6.4.16 Kemira
- 6.4.17 SNF Floerger
- 6.4.18 MPRC
- 6.4.19 Ecolab
- 6.4.20 Nouryon
- 6.4.21 SLB (Schlumberger Limited)
- 6.4.22 Solvay
- 6.4.23 The Lubrizol Corporation
- 6.4.24 Weatherford
- 6.4.25 Zirax
7 Market Opportunities and Future Outlook
- 7.1 White-space and Unmet-Need Assessment
- 7.2 Digitally enabled "intelligent chemistry" programs lowering OPEX and emissions

