PUBLISHER: Mordor Intelligence | PRODUCT CODE: 2120662

PUBLISHER: Mordor Intelligence | PRODUCT CODE: 2120662
Bio-degradable Polymers - Market Share Analysis, Industry Trends & Statistics, Growth Forecasts (2026 - 2031)
According to Mordor Intelligence, the bio-degradable polymers market size is expected to increase from 1.11 Million tons in 2025 to 1.08 Million tons in 2026 and reach 2.35 Million tons by 2031, growing at a CAGR of 16.78% over 2026-2031.
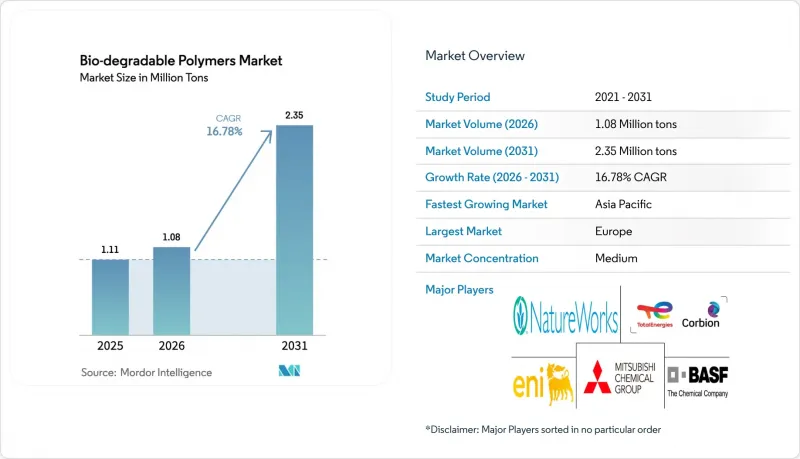
This report is Segmented by Feedstock (Sugarcane and Sugar Beets, Corn and Other Starch Crops, and More), Type (Starch-Based Plastics, Polylactic Acid (PLA), and More), End-User Industry (Packaging, Consumer Goods, Textile, Agriculture, and More), and Geography (Asia-Pacific, North America, Europe, South America, and Middle-East and Africa). The Market Forecasts are Provided in Terms of Volume (Tons).
Global Bio-degradable Polymers Market Trends and Insights
Government Regulations Banning Single-Use Plastics
The EU Single-Use Plastics Directive, fully enforced from January 2024, eliminated oxo-degradable items across ten categories and lifted PLA and starch-film demand above 180,000 tons in 2025. China's nationwide plastic-bag ban and restrictions on non-degradable mulch films injected provincial subsidies that added 320,000 tons of PLA and PBAT nameplate capacity by 2025. India's 2024 amendment to the Plastic-Waste Rules barred thin single-use plastics, opening a 95,000-ton starch-blend opportunity that meets IS 17088 criteria. Producers now co-locate near high-enforcement regions: NatureWorks' Thailand PLA plant supplies ASEAN, while Danimer Scientific's Kentucky PHA line targets U.S. coastal markets.
Rising Demand for Sustainable, Eco-Friendly Packaging
Unilever pledged to convert 35% of its flexible films to certified-compostable materials by 2027, securing multi-year offtakes with TotalEnergies Corbion and BASF. Nestle trials PHA-coated paperboard wrappers for confectionery in Europe, creating a 22,000-ton barrier-grade PHA window by 2026. Procter & Gamble's 2024 patent on marine-degradable PLA-PBAT detergent pods adds a coastal disposal solution. Amazon disclosed that 18% of its North American shipments already use starch loose-fill and PLA mailers, displacing 43,000 tons of polyethylene in 2025. Brand-owner demand increasingly specifies industrial, home, or marine degradation pathways, fragmenting certification needs and widening portfolio complexity.
High Production Cost vs. Conventional Plastics
Commodity PLA sells at USD 2.80-3.50 per kg versus USD 1.20-1.40 for polyethylene, maintaining a 90-140% premium that restricts uptake outside mandated or fee-burdened streams. Marine-grade PHA commands USD 5.00-6.50 per kg, reflecting fermentation complexity. Corn-starch price spikes of 28% in 2024 compressed NatureWorks and Cargill gross margins to 24%. Greenfield PHA plants require USD 180-220 million per 50,000-ton line, double comparable polyethylene units, slowing new entrant traction. Learning rates of 12-15% per capacity doubling lag conventional plastics, prolonging parity timelines.
Other drivers and restraints analyzed in the detailed report include:
- Accelerating Adoption in Healthcare Applications
- Growing Use of Biodegradable Films in Agriculture
- Limited Mechanical Performance for Automotive Parts
For complete list of drivers and restraints, kindly check the Table Of Contents.
Segment Analysis
Sugarcane and sugar beets delivered 37.91% of 2025 volume, anchored by Brazil's vast cane acreage and European beet output that supply fermentable sugars at USD 0.32-0.38 per kg. This cost base underpins the bio-degradable polymers market size for PLA and bio-PE production in both hemispheres. Corn and other starch crops are benefiting from established wet-milling and rail logistics in the United States and Northeast China.
Algal and microbial biomass is expanding at an 18.26% CAGR on titers above 120 g/L for PHA, a trajectory that could lift its bio-degradable polymers market share as fermentation costs near PLA parity. Cellulose residues secured moderate share as Nordic pulp mills valorize waste streams, while waste oils face tightening supplies from renewable-diesel mandates.
Complete Report Scope:
- By Feedstock
- Sugarcane and Sugar Beets
- Corn and Other Starch Crops
- Cellulose and Wood Biomass
- Waste Vegetable Oils and Fats
- Algal and Microbial Biomass
- By Type
- Starch-Based Plastics
- Polylactic Acid (PLA)
- Polyhydroxyalkanoates (PHA)
- Polyesters (PBS, PBAT and PCL)
- Cellulosic Derivatives
- By End-user Industry
- Packaging
- Consumer Goods
- Textile
- Agriculture
- Healthcare
- Other End-user Industries (Automotive, Construction, etc.)
- By Geography
- Asia-Pacific
- China
- India
- Japan
- South Korea
- ASEAN Countries
- Rest of Asia-Pacific
- North America
- United States
- Canada
- Mexico
- Europe
- Germany
- United Kingdom
- Italy
- France
- NORDIC Countries
- Rest of Europe
- South America
- Brazil
- Argentina
- Rest of South America
- Middle-East and Africa
- Saudi Arabia
- South Africa
- Rest of Middle-East and Africa
- Asia-Pacific
Geography Analysis
Europe accounted for 38.95% of 2025 volume, supported by harmonized certification, robust composting infrastructure, and national bans that elevate average selling prices by 12-18% over non-certified imports. Germany's market is driven by BASF's ecovio(R) integration and stringent DIN CERTCO requirements that favor local supply. France and Italy followed demand as carrier-bag and mulch-film regulations accelerated substitution.
Asia-Pacific is poised to overturn European dominance with a 19.24% CAGR. China's capacity additions during 2024-2025 and India's single-use bans together underpin projected incremental tonnage. Zhejiang Hisun's 100,000-ton PBAT line and NatureWorks' planned Thai expansion illustrate capital allocation toward regional self-sufficiency. ASEAN agricultural-film subsidies further expand addressable demand.
North America captured moderate consumption, with California, New York, and Washington leading bag and food-service bans. Canada's federal prohibition bolstered demand, while Mexico City and Jalisco state measures lifted Mexico's consumption. South America and the Middle East and Africa remain smaller but benefit from cane-based bio-PE in Brazil and emerging circular-economy policies in Saudi Arabia and South Africa.
- BASF
- BEWI
- Biome Bioplastics
- BIOTEC Biologische Naturverpackungen GmbH & Co. KG.
- Braskem
- CJ CheilJedang Corp
- Danimer Scientific
- DuPont
- Eni S.p.A.
- Evonik Industries AG
- FKuR
- GENECIS
- Mitsubishi Chemical Group Corporation
- NatureWorks LLC
- Plantic
- PTT MCC Biochem Co., Ltd.
- TEIJIN LIMITED
- TORAY INDUSTRIES, INC.
- TotalEnergies Corbion
- Zhejiang Hisun Biomaterials Co., Ltd.
Additional Benefits:
- The market estimate (ME) sheet in Excel format
- 3 months of analyst support
TABLE OF CONTENTS
1 Introduction
- 1.1 Study Assumptions and Market Definition
- 1.2 Scope of the Study
2 Research Methodology
3 Executive Summary
4 Market Landscape
- 4.1 Market Overview
- 4.2 Market Drivers
- 4.2.1 Government Regulations Banning Single-Use Plastics
- 4.2.2 Rising Demand for Sustainable, Eco-Friendly Packaging
- 4.2.3 Accelerating Adoption in Healthcare Applications
- 4.2.4 Growing Use of Biodegradable Films in Agriculture
- 4.2.5 Carbon-Capture-Derived Monomers Enabling Negative-Emission Plastics
- 4.3 Market Restraints
- 4.3.1 High Production Cost Vs. Conventional Plastics
- 4.3.2 Limited Mechanical Performance for Automotive Parts
- 4.3.3 Feedstock-Price Volatility from Non-Food Biomass Demand
- 4.4 Value Chain Analysis
- 4.5 Porter's Five Forces
- 4.5.1 Bargaining Power of Suppliers
- 4.5.2 Bargaining Power of Buyers
- 4.5.3 Threat of New Entrants
- 4.5.4 Threat of Substitutes
- 4.5.5 Degree of Competition
5 Market Size and Growth Forecasts (Volume)
- 5.1 By Feedstock
- 5.1.1 Sugarcane and Sugar Beets
- 5.1.2 Corn and Other Starch Crops
- 5.1.3 Cellulose and Wood Biomass
- 5.1.4 Waste Vegetable Oils and Fats
- 5.1.5 Algal and Microbial Biomass
- 5.2 By Type
- 5.2.1 Starch-Based Plastics
- 5.2.2 Polylactic Acid (PLA)
- 5.2.3 Polyhydroxyalkanoates (PHA)
- 5.2.4 Polyesters (PBS, PBAT and PCL)
- 5.2.5 Cellulosic Derivatives
- 5.3 By End-user Industry
- 5.3.1 Packaging
- 5.3.2 Consumer Goods
- 5.3.3 Textile
- 5.3.4 Agriculture
- 5.3.5 Healthcare
- 5.3.6 Other End-user Industries (Automotive, Construction, etc.)
- 5.4 By Geography
- 5.4.1 Asia-Pacific
- 5.4.1.1 China
- 5.4.1.2 India
- 5.4.1.3 Japan
- 5.4.1.4 South Korea
- 5.4.1.5 ASEAN Countries
- 5.4.1.6 Rest of Asia-Pacific
- 5.4.2 North America
- 5.4.2.1 United States
- 5.4.2.2 Canada
- 5.4.2.3 Mexico
- 5.4.3 Europe
- 5.4.3.1 Germany
- 5.4.3.2 United Kingdom
- 5.4.3.3 Italy
- 5.4.3.4 France
- 5.4.3.5 NORDIC Countries
- 5.4.3.6 Rest of Europe
- 5.4.4 South America
- 5.4.4.1 Brazil
- 5.4.4.2 Argentina
- 5.4.4.3 Rest of South America
- 5.4.5 Middle-East and Africa
- 5.4.5.1 Saudi Arabia
- 5.4.5.2 South Africa
- 5.4.5.3 Rest of Middle-East and Africa
- 5.4.1 Asia-Pacific
6 Competitive Landscape
- 6.1 Market Concentration
- 6.2 Strategic Moves
- 6.3 Market Share (%)/Ranking Analysis
- 6.4 Company Profiles {(includes Global level Overview, Market level overview, Core Segments, Financials as available, Strategic Information, Products and Services, Recent Developments)}
- 6.4.1 BASF
- 6.4.2 BEWI
- 6.4.3 Biome Bioplastics
- 6.4.4 BIOTEC Biologische Naturverpackungen GmbH & Co. KG.
- 6.4.5 Braskem
- 6.4.6 CJ CheilJedang Corp
- 6.4.7 Danimer Scientific
- 6.4.8 DuPont
- 6.4.9 Eni S.p.A.
- 6.4.10 Evonik Industries AG
- 6.4.11 FKuR
- 6.4.12 GENECIS
- 6.4.13 Mitsubishi Chemical Group Corporation
- 6.4.14 NatureWorks LLC
- 6.4.15 Plantic
- 6.4.16 PTT MCC Biochem Co., Ltd.
- 6.4.17 TEIJIN LIMITED
- 6.4.18 TORAY INDUSTRIES, INC.
- 6.4.19 TotalEnergies Corbion
- 6.4.20 Zhejiang Hisun Biomaterials Co., Ltd.
7 Market Opportunities and Future Outlook
- 7.1 White-space and Unmet-Need Assessment
- 7.2 Marine-degradable Polymers for Ocean Cleanup Nets and Gear

