PUBLISHER: Mordor Intelligence | PRODUCT CODE: 2120764

PUBLISHER: Mordor Intelligence | PRODUCT CODE: 2120764
Europe Data Center Cooling - Market Share Analysis, Industry Trends & Statistics, Growth Forecasts (2026 - 2031)
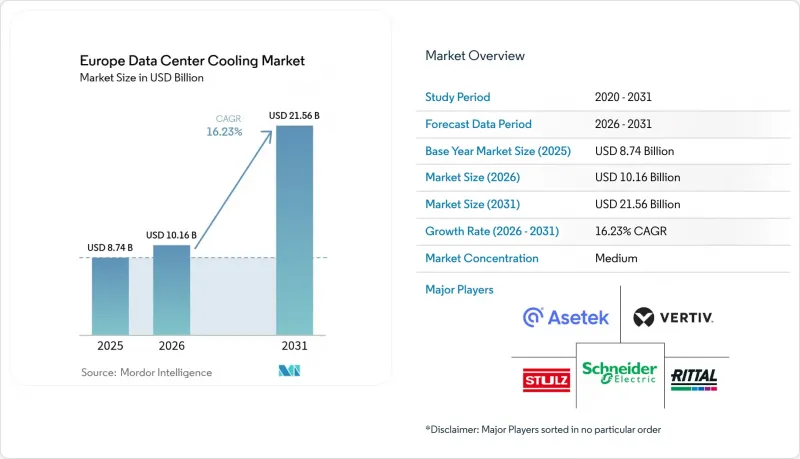
According to Mordor Intelligence, Europe data center cooling market size in 2026 is estimated at USD 10.16 billion, growing from 2025 value of USD 8.74 billion with 2031 projections showing USD 21.56 billion, growing at 16.23% CAGR over 2026-2031.
This report is Segmented by Data Center Type (Hyperscalers (owned and Leased), Enterprise and Edge, Colocation), Tier Type (Tier 1 and 2, Tier 3, Tier 4), Cooling Technology (Air Based Cooling, Liquid Based Cooling), Component (Service, Equipment), and by Country. The Market Forecasts are Provided in Terms of Value (USD).
Europe Data Center Cooling Market Trends and Insights
Surging AI-led Rack Power Densities
AI training clusters are pushing rack loads from 10-15 kW toward 40-60 kW, a shift that renders conventional CRAH units inadequate. Vertiv cited a 37% year-on-year rise in liquid-cooling orders during Q3 2024 as GPU-intensive builds accelerated. Sovereign AI programs amplify the trend: Beyond.pl's new Sovereign AI Factory in Poland uses micro-modular liquid pods to condense national compute into secure footprints.Higher fluid-cooling content is driving copper demand, adding further strain to supply chains already coping with long lead times.
EU Green Deal and Related Energy-Efficiency Mandates
The Energy Efficiency Directive obliges sites above 1 MW to recover waste heat unless technically infeasible, steering designs toward low-exergy cooling loops linked to municipal networks. Retelit's Avalon 3 centre in Milan already diverts 2.5 MWt into district heating, cutting 3,300 t of annual CO2. In parallel, the F-gas phase-down accelerates migration to low-GWP refrigerants or non-refrigerant liquid technologies.
High CAPEX for Liquid-Cooling Retrofits
Upgrading an existing hall to direct-to-chip loops can cost beyond USD 1,000 per kW, a figure that drives operators to weigh greenfield builds against retrofits. Component lead times of 12-16 months for pumps, CDU valves, and high-capacity chillers extend project paybacks. Skills scarcity adds opex, as water-chemistry expertise commands premium rates.
Other drivers and restraints analyzed in the detailed report include:
- Hyperscale and Colocation Build-outs in FLAP-D Corridor
- Northern Europe's Free-Cooling Climate Advantage
- EU-wide F-gas / Refrigerant Phase-Down Complexity
For complete list of drivers and restraints, kindly check the Table Of Contents.
Segment Analysis
Hyperscaler facilities captured 46.78% of the European data center cooling market share in 2025 and are projected to rise at a 16.62% CAGR, confirming their outsized influence on technology migration. Their extensive capital budgets absorb the higher upfront costs of immersion tanks and rear-door heat exchangers, accelerating ecosystem learning curves. Enterprise and edge sites lag in adoption but are piloting modular coolant distribution to meet localized AI inference. Colocation operators are carving a middle path by offering "liquid-cooling suites" that de-risk client transformation, an approach that underpins rising service revenue.
Sovereign AI mandates intensify hyperscaler momentum. Microsoft's newest European builds dedicate entire halls to liquid-ready racks, enabling compute footprints that conventional air layouts cannot host. Colocation landlords respond by marketing liquid cooling as a service, a premium they recover via higher-density fees. Edge operators, pressured by latency requirements, are embracing compact dielectric-fluid pods, illustrating how scale dynamics filter through the entire ecosystem.
Tier 3 remains the mainstream choice with 64.92% share of the Europe data center cooling market size in 2025, favored for balanced resilience and cost. Yet Tier 4 footprints expand at 17.05% CAGR as sovereign clouds and regulated sectors require simultaneous maintainability. Tier 4 blueprints frequently integrate dual coolant loops with N+N pumps, setting new reliability norms.
Tier 3 managers are adopting selective liquid retrofits, rear-door exchangers for AI tenants, CRAH rows for general-purpose racks, creating hybrid environments that prolong asset life. Tier 1/2 facilities hold niche relevance for content distribution and backup; their simplified cooling often leverages indirect free cooling to minimize spend. Standards bodies are reviewing whether current Tier definitions sufficiently account for liquid system redundancy, suggesting future design codifications.
Complete Report Scope:
- By Data Center Type
- Hyperscalers (owned and Leased)
- Enterprise and Edge
- Colocation
- By Tier Type
- Tier 1 and 2
- Tier 3
- Tier 4
- By Cooling Technology
- Air-based Cooling
- Chiller and Economizer (DX Systems)
- CRAH
- Cooling Tower (covers direct, indirect and two-stage cooling)
- Others
- Liquid-based Cooling
- Immersion Cooling
- Direct-to-Chip Cooling
- Rear-Door Heat Exchanger
- Air-based Cooling
- By Component
- By Service
- Consulting and Training
- Installation and Deployment
- Maintenance and Support
- By Equipment
- By Service
- By Country
- United Kingdom
- Germany
- Netherlands
- Spain
- Poland
- Switzerland
- Austria
- Rest of Europe
List of Companies Covered in this Report:
- Vertiv Group Corp.
- Stulz GmbH
- Schneider Electric SE
- Rittal GmbH and Co. KG
- Asetek A/S
- Alfa Laval AB
- Iceotope Technologies Ltd.
- Green Revolution Cooling Inc.
- Chilldyne Inc.
- Airedale International Air Conditioning Ltd.
- Johnson Controls International plc
- Daikin Europe NV
- Munters Group AB
- Submer Technologies SL
- CoolIT Systems Inc.
- Danfoss A/S
- Parker Hannifin Corp.
- Trane Technologies plc
- Sensata Technologies Inc.
- Asperitas BV
Additional Benefits:
- The market estimate (ME) sheet in Excel format
- 3 months of analyst support
TABLE OF CONTENTS
1 INTRODUCTION
- 1.1 Study Assumptions and Market Definition
- 1.2 Scope of the Study
2 RESEARCH METHODOLOGY
3 EXECUTIVE SUMMARY
4 MARKET LANDSCAPE
- 4.1 Market Overview
- 4.2 Market Drivers
- 4.2.1 Surging AI?led rack power densities
- 4.2.2 EU Green Deal and related energy?efficiency mandates
- 4.2.3 Hyperscale and colocation build-outs in FLAP-D corridor
- 4.2.4 Northern Europes free-cooling climate advantage
- 4.2.5 District-heating revenue from waste-heat re-use
- 4.2.6 Sovereign AI clusters adopting micro-modular liquid cooling
- 4.3 Market Restraints
- 4.3.1 High CAPEX for liquid-cooling retrofits
- 4.3.2 EU-wide F-gas / refrigerant phase-down complexity
- 4.3.3 Shortage of certified water-treatment skills
- 4.3.4 Grid-connection moratoria in power-tight metros
- 4.4 Supply-Chain Analysis
- 4.5 Regulatory Landscape
- 4.6 Technological Outlook
- 4.7 Porter's Five Forces Analysis
- 4.7.1 Threat of New Entrants
- 4.7.2 Bargaining Power of Suppliers
- 4.7.3 Bargaining Power of Buyers
- 4.7.4 Threat of Substitutes
- 4.7.5 Competitive Rivalry
- 4.8 Assesment of Macroeconomic Factors on the Market
5 MARKET SIZE and GROWTH FORECASTS(VALUE)
- 5.1 By Data Center Type
- 5.1.1 Hyperscalers (owned and Leased)
- 5.1.2 Enterprise and Edge
- 5.1.3 Colocation
- 5.2 By Tier Type
- 5.2.1 Tier 1 and 2
- 5.2.2 Tier 3
- 5.2.3 Tier 4
- 5.3 By Cooling Technology
- 5.3.1 Air-based Cooling
- 5.3.1.1 Chiller and Economizer (DX Systems)
- 5.3.1.2 CRAH
- 5.3.1.3 Cooling Tower (covers direct, indirect and two-stage cooling)
- 5.3.1.4 Others
- 5.3.2 Liquid-based Cooling
- 5.3.2.1 Immersion Cooling
- 5.3.2.2 Direct-to-Chip Cooling
- 5.3.2.3 Rear-Door Heat Exchanger
- 5.3.1 Air-based Cooling
- 5.4 By Component
- 5.4.1 By Service
- 5.4.1.1 Consulting and Training
- 5.4.1.2 Installation and Deployment
- 5.4.1.3 Maintenance and Support
- 5.4.2 By Equipment
- 5.4.1 By Service
- 5.5 By Country
- 5.5.1 United Kingdom
- 5.5.2 Germany
- 5.5.3 Netherlands
- 5.5.4 Spain
- 5.5.5 Poland
- 5.5.6 Switzerland
- 5.5.7 Austria
- 5.5.8 Rest of Europe
6 COMPETITIVE LANDSCAPE
- 6.1 Market Concentration
- 6.2 Strategic Moves
- 6.3 Market Share Analysis
- 6.4 Company Profiles (includes Global level Overview, Market level overview, Core Segments, Financials as available, Strategic Information, Market Rank/Share for key companies, Products and Services, and Recent Developments)
- 6.4.1 Vertiv Group Corp.
- 6.4.2 Stulz GmbH
- 6.4.3 Schneider Electric SE
- 6.4.4 Rittal GmbH and Co. KG
- 6.4.5 Asetek A/S
- 6.4.6 Alfa Laval AB
- 6.4.7 Iceotope Technologies Ltd.
- 6.4.8 Green Revolution Cooling Inc.
- 6.4.9 Chilldyne Inc.
- 6.4.10 Airedale International Air Conditioning Ltd.
- 6.4.11 Johnson Controls International plc
- 6.4.12 Daikin Europe NV
- 6.4.13 Munters Group AB
- 6.4.14 Submer Technologies SL
- 6.4.15 CoolIT Systems Inc.
- 6.4.16 Danfoss A/S
- 6.4.17 Parker Hannifin Corp.
- 6.4.18 Trane Technologies plc
- 6.4.19 Sensata Technologies Inc.
- 6.4.20 Asperitas BV
7 MARKET OPPORTUNITIES and FUTURE OUTLOOK
- 7.1 White-space and Unmet-Need Assessment

