PUBLISHER: Mordor Intelligence | PRODUCT CODE: 2121329

PUBLISHER: Mordor Intelligence | PRODUCT CODE: 2121329
Smart Manufacturing - Market Share Analysis, Industry Trends & Statistics, Growth Forecasts (2026 - 2031)
According to Mordor Intelligence, the smart manufacturing market size is USD 387.14 billion in 2026 and is projected to reach USD 730.04 billion by 2031, reflecting a 13.53% CAGR.
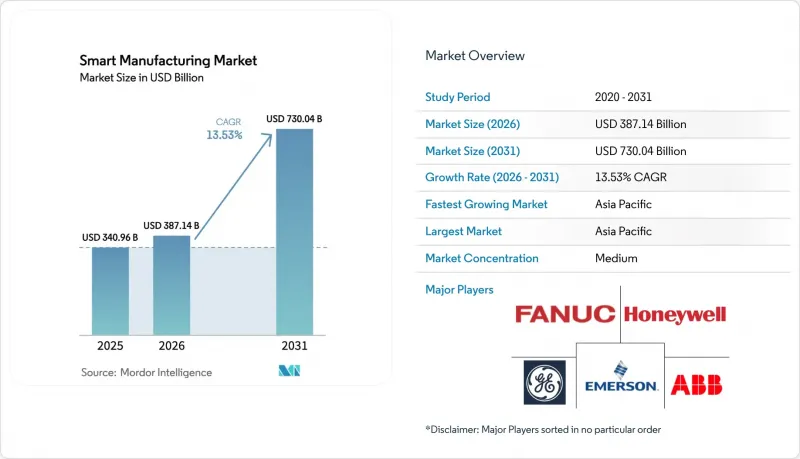
This report is Segmented by Technology (Programmable Logic Controller (PLC), Supervisory Controller and Data Acquisition (SCADA), and More), Component (Hardware, Software, and More), Deployment Mode (On-Premise, Cloud, and Hybrid), End-User Industry (Automotive, Semiconductors and Electronics, Chemical and Petrochemical, and More), and Geography. The Market Forecasts are Provided in Terms of Value (USD).
Global Smart Manufacturing Market Trends and Insights
Rising Adoption of Industry 4.0 and IIoT for Efficiency
Factories move from pilot projects to full-scale IIoT rollouts, cutting unplanned downtime by as much as 20% after adding low-cost edge sensors to legacy equipment. Supervisory control and data acquisition backbones lower the marginal cost of new nodes, helping automotive and semiconductor lines generate predictive alerts that avert million-dollar stoppages. Pharmaceutical plants extend the architecture into cleanrooms to monitor particulate counts in real time, trimming batch rejection rates and raising gross margins. Certification frameworks now reference digital audit trails, making IIoT adoption a prerequisite for quality-management renewals. As operational and information technology converge, plants deploy zero-trust segmentation and traffic anomaly analytics to curb lateral cyber threats.
Government Incentives and Policy Mandates for Digital Factories
The United States CHIPS and Science Act directs USD 39 billion in subsidies toward fabs that install advanced manufacturing execution systems by 2027. Germany's Industry 4.0 grants reimburse up to 40% of retrofit costs for small and medium plants that add cloud-connected controllers and human-machine interfaces. India's Production-Linked Incentive schemes tie payouts to real-time genealogy tracking in electronics and pharmaceuticals. China's 14th Five-Year Plan obliges state-owned enterprises in steel, chemicals, and energy to reach "intelligent manufacturing" targets by 2025, inflating domestic orders for distributed control and edge-analytics platforms. Companies delaying upgrades risk losing access to subsidized capital and export markets that demand digital traceability.
High CAPEX and Uncertain SME ROI
Small and medium enterprises cover 60% of manufacturing employment but just 28% of smart-manufacturing capex, because entry-level execution systems run USD 200,000-USD 800,000, well above typical IT budgets. Legacy controllers often lack Ethernet ports, forcing purchases of gateway devices and custom protocol translation. A 2025 survey found that more than half of European SMEs could not quantify productivity gains within 18 months, leading to budget freezes. Subscription pricing lowers upfront costs but adds recurring fees, and banks in emerging markets demand high equity contributions for automation loans.
Other drivers and restraints analyzed in the detailed report include:
- Skilled-Labor Shortages Accelerating Automation Uptake
- Carbon-Border Adjustment Mechanism Driving Factory-level Energy Transparency
- Cyber-Security and Data-Sovereignty Concerns
For complete list of drivers and restraints, kindly check the Table Of Contents.
Segment Analysis
Digital-twin platforms will capture more incremental value than any other technology as factories simulate entire lines before physical retooling. Programmable logic controllers remain vital, yet their 31.23% revenue share in 2025 signals maturity rather than growth. Demand for virtual replicas rises especially in aerospace and automotive, where every minute of physical downtime carries six-figure costs. Digital-twin tools link with product lifecycle management to help engineers test hundreds of "what-if" scenarios without stopping a running line. In discrete electronics, twins shorten new-product introductions because layout changes surface virtually, not on shop floors.
Distributed control systems stay entrenched in chemicals and oil and gas, where safety demands deterministic response times. Edge analytics blends with supervisory control and data acquisition, embedding machine-learning models inside controller firmware so pumps alert staff to bearing wear well before vibration exceeds thresholds. Mobile human-machine interfaces replace fixed panels, shaving average repair time by nearly 15 minutes per incident. The International Electrotechnical Commission's IEC 61499 standard gains traction in modular lines that must switch between short batches without extensive reprogramming. This convergence suggests the smart manufacturing market will rely on software-driven orchestration layered over a hardware foundation.
Hardware still accounted for 44.13% of expenditure in 2025, yet falling sensor and robot prices mean future growth will shift to software and integration. Sensors for temperature or vibration now cost under USD 10 each, allowing plants to instrument every motor. Collating millions of data points per second strains legacy systems, pushing the smart manufacturing market toward high-performance time-series databases that scale horizontally. Software revenue grows steadily as perpetual licenses give way to cloud subscriptions, driving up long-run ownership cost but smoothing cash flow for vendors.
Services expand at a 16.89% CAGR because multi-vendor stacks turn deployment into a complex engineering project. Integrators blend programmable logic controllers from one vendor with supervision from another and enterprise resource planning from a third. Specialists bundle pre-configured templates for pharmaceutical batch execution or automotive mixed-model assembly, halving go-live timelines. Managed services appeal to smaller plants that lack automation engineers, offering remote monitoring, software patching, and cybersecurity under monthly contracts. As integration eclipses procurement, services will anchor the next growth wave within the smart manufacturing market size metrics.
Complete Report Scope:
- By Technology
- Programmable Logic Controller (PLC)
- Supervisory Control and Data Acquisition (SCADA)
- Enterprise Resource Planning (ERP)
- Distributed Control System (DCS)
- Human-Machine Interface (HMI)
- Product Lifecycle Management (PLM)
- Manufacturing Execution System (MES)
- Other Technologies
- By Component
- Hardware
- Robotics
- Sensors
- Machine-Vision Systems
- Control Devices
- Software
- MES
- PLM
- SCADA / ERP Suites
- Digital-Twin / AI and Analytics
- Services
- Integration and Implementation
- Consulting and Training
- Managed Services
- Communication Segment
- Hardware
- By Deployment Mode
- On-Premise
- Cloud
- Hybrid
- By End-User Industry
- Automotive
- Semiconductors and Electronics
- Oil and Gas
- Chemical and Petrochemical
- Pharmaceuticals and Life Sciences
- Food and Beverage
- Energy and Utilities
- Logistics and Warehousing
- Other End-User Industries
- By Geography
- North America
- United States
- Canada
- Mexico
- Europe
- Germany
- United Kingdom
- France
- Italy
- Spain
- Russia
- Rest of Europe
- Asia Pacific
- China
- Japan
- India
- South Korea
- ASEAN
- Australia and New Zealand
- Rest of Asia Pacific
- South America
- Brazil
- Argentina
- Rest of South America
- Middle East
- Saudi Arabia
- United Arab Emirates
- Turkey
- Rest of Middle East
- Africa
- South Africa
- Nigeria
- Rest of Africa
- North America
Geography Analysis
Asia-Pacific held 36.53% of smart manufacturing revenue in 2025 and will deliver a 14.54% compound growth pace through 2031, outstripping every other region. China alone deployed more than 400 private 5G factory networks, and its five-year plan mandates intelligent-manufacturing milestones by 2025. India's subsidies channel USD 6.5 billion into digital traceability for electronics and pharmaceuticals, cutting average payback to under two years. Japan's aging workforce accelerates collaborative-robot rollouts, while South Korea instruments every semiconductor tool down to electrodes to safeguard yields at sub-3-nanometer nodes.
North America benefits from USD 39 billion in U.S. CHIPS Act grants, which require advanced execution systems, and tax credits that reward energy-monitoring layers. Mexico's nearshoring boom pulls capital south of the border to brand-new lines designed around digital twins and private 5G. Canada's aerospace cluster adds machine-vision inspection on composite assemblies. Europe leans on its Carbon Border Adjustment Mechanism, pushing exporters to retrofit energy-monitoring devices now to avoid future tariffs. Germany extends 40% retrofit grants for small plants, and the United Kingdom rebuilds automotive lines for electric vehicles.
Middle East and Africa pursue national industrial agendas. Saudi Arabia funds petrochemical, metals, and food projects under Vision 2030, with every new line stipulating programmable logic controllers and edge analytics. The United Arab Emirates ties AI grants to digital-factory pilots in desalination and aluminum smelting. South Africa's cloud adoption lags because plants rely on diesel generators during power outages. Still, Kenya's textiles adopt basic smart-factory layers where export contracts justify the cost.
- ABB Ltd.
- Emerson Electric Co.
- FANUC Corporation
- General Electric Co.
- Honeywell International Inc.
- Mitsubishi Electric Corp.
- Robert Bosch GmbH
- Rockwell Automation Inc.
- Schneider Electric SE
- Siemens AG
- Texas Instruments Inc.
- Yokogawa Electric Corp.
- Cisco Systems Inc.
- IBM Corporation
- Oracle Corporation
- SAP SE
- Johnson Controls Intl. plc
- PTC Inc.
- Dassault Systemes SE
- 3D Systems Corp.
- Stratasys Ltd.
- Delta Electronics Inc.
- Capgemini SE
- Renishaw plc
Additional Benefits:
- The market estimate (ME) sheet in Excel format
- 3 months of analyst support
TABLE OF CONTENTS
1 INTRODUCTION
- 1.1 Study Assumptions and Market Definition
- 1.2 Scope of the Study
2 RESEARCH METHODOLOGY
3 EXECUTIVE SUMMARY
4 MARKET LANDSCAPE
- 4.1 Market Overview
- 4.2 Market Drivers
- 4.2.1 Rising Adoption of Industry 4.0 / IIoT for Efficiency
- 4.2.2 Government Incentives and Policy Mandates for Digital Factories
- 4.2.3 Skilled-Labour Shortages Accelerating Automation Uptake
- 4.2.4 Carbon-Border Adjustment Mechanism Driving Factory-level Energy Transparency
- 4.2.5 Digital-Twin-based Predictive-Maintenance Revenue Streams
- 4.2.6 Roll-out of Private 5G Networks Enabling Ultra-Low-Latency Control
- 4.3 Market Restraints
- 4.3.1 High CAPEX and Uncertain SME ROI
- 4.3.2 Cyber-Security and Data-Sovereignty Concerns
- 4.3.3 Legacy Analogue Equipment Limiting Interoperability
- 4.3.4 Semiconductor Supply-Chain Volatility Delaying Control Hardware
- 4.4 Impact of Macroeconomic Factors on the Market
- 4.5 Industry Value Chain Analysis
- 4.6 Regulatory Landscape
- 4.7 Technological Outlook
- 4.8 Porter's Five Forces Analysis
- 4.8.1 Bargaining Power of Suppliers
- 4.8.2 Bargaining Power of Buyers
- 4.8.3 Threat of New Entrants
- 4.8.4 Threat of Substitutes
- 4.8.5 Intensity of Competitive Rivalry
5 MARKET SIZE AND GROWTH FORECASTS (VALUE)
- 5.1 By Technology
- 5.1.1 Programmable Logic Controller (PLC)
- 5.1.2 Supervisory Control and Data Acquisition (SCADA)
- 5.1.3 Enterprise Resource Planning (ERP)
- 5.1.4 Distributed Control System (DCS)
- 5.1.5 Human-Machine Interface (HMI)
- 5.1.6 Product Lifecycle Management (PLM)
- 5.1.7 Manufacturing Execution System (MES)
- 5.1.8 Other Technologies
- 5.2 By Component
- 5.2.1 Hardware
- 5.2.1.1 Robotics
- 5.2.1.2 Sensors
- 5.2.1.3 Machine-Vision Systems
- 5.2.1.4 Control Devices
- 5.2.2 Software
- 5.2.2.1 MES
- 5.2.2.2 PLM
- 5.2.2.3 SCADA / ERP Suites
- 5.2.2.4 Digital-Twin / AI and Analytics
- 5.2.3 Services
- 5.2.3.1 Integration and Implementation
- 5.2.3.2 Consulting and Training
- 5.2.3.3 Managed Services
- 5.2.4 Communication Segment
- 5.2.1 Hardware
- 5.3 By Deployment Mode
- 5.3.1 On-Premise
- 5.3.2 Cloud
- 5.3.3 Hybrid
- 5.4 By End-User Industry
- 5.4.1 Automotive
- 5.4.2 Semiconductors and Electronics
- 5.4.3 Oil and Gas
- 5.4.4 Chemical and Petrochemical
- 5.4.5 Pharmaceuticals and Life Sciences
- 5.4.6 Food and Beverage
- 5.4.7 Energy and Utilities
- 5.4.8 Logistics and Warehousing
- 5.4.9 Other End-User Industries
- 5.5 By Geography
- 5.5.1 North America
- 5.5.1.1 United States
- 5.5.1.2 Canada
- 5.5.1.3 Mexico
- 5.5.2 Europe
- 5.5.2.1 Germany
- 5.5.2.2 United Kingdom
- 5.5.2.3 France
- 5.5.2.4 Italy
- 5.5.2.5 Spain
- 5.5.2.6 Russia
- 5.5.2.7 Rest of Europe
- 5.5.3 Asia Pacific
- 5.5.3.1 China
- 5.5.3.2 Japan
- 5.5.3.3 India
- 5.5.3.4 South Korea
- 5.5.3.5 ASEAN
- 5.5.3.6 Australia and New Zealand
- 5.5.3.7 Rest of Asia Pacific
- 5.5.4 South America
- 5.5.4.1 Brazil
- 5.5.4.2 Argentina
- 5.5.4.3 Rest of South America
- 5.5.5 Middle East
- 5.5.5.1 Saudi Arabia
- 5.5.5.2 United Arab Emirates
- 5.5.5.3 Turkey
- 5.5.5.4 Rest of Middle East
- 5.5.6 Africa
- 5.5.6.1 South Africa
- 5.5.6.2 Nigeria
- 5.5.6.3 Rest of Africa
- 5.5.1 North America
6 COMPETITIVE LANDSCAPE
- 6.1 Market Concentration
- 6.2 Strategic Moves
- 6.3 Market Share Analysis
- 6.4 Company Profiles (includes Global Level Overview, Market Level Overview, Core Segments, Financials as Available, Strategic Information, Market Rank/Share for Key Companies, Products and Services, and Recent Developments)
- 6.4.1 ABB Ltd.
- 6.4.2 Emerson Electric Co.
- 6.4.3 FANUC Corporation
- 6.4.4 General Electric Co.
- 6.4.5 Honeywell International Inc.
- 6.4.6 Mitsubishi Electric Corp.
- 6.4.7 Robert Bosch GmbH
- 6.4.8 Rockwell Automation Inc.
- 6.4.9 Schneider Electric SE
- 6.4.10 Siemens AG
- 6.4.11 Texas Instruments Inc.
- 6.4.12 Yokogawa Electric Corp.
- 6.4.13 Cisco Systems Inc.
- 6.4.14 IBM Corporation
- 6.4.15 Oracle Corporation
- 6.4.16 SAP SE
- 6.4.17 Johnson Controls Intl. plc
- 6.4.18 PTC Inc.
- 6.4.19 Dassault Systemes SE
- 6.4.20 3D Systems Corp.
- 6.4.21 Stratasys Ltd.
- 6.4.22 Delta Electronics Inc.
- 6.4.23 Capgemini SE
- 6.4.24 Renishaw plc
7 MARKET OPPORTUNITIES AND FUTURE OUTLOOK
- 7.1 White-Space and Unmet-Need Assessment

