PUBLISHER: Mordor Intelligence | PRODUCT CODE: 2121347

PUBLISHER: Mordor Intelligence | PRODUCT CODE: 2121347
Asia-Pacific Silica Sand - Market Share Analysis, Industry Trends & Statistics, Growth Forecasts (2026 - 2031)
According to Mordor Intelligence, the Asia-Pacific silica sand market size was valued at 170.37 Million tons in 2025 and is estimated to grow from 180.68 Million tons in 2026 to reach 249.41 Million tons by 2031, at a CAGR of 6.66% during the forecast period (2026-2031).
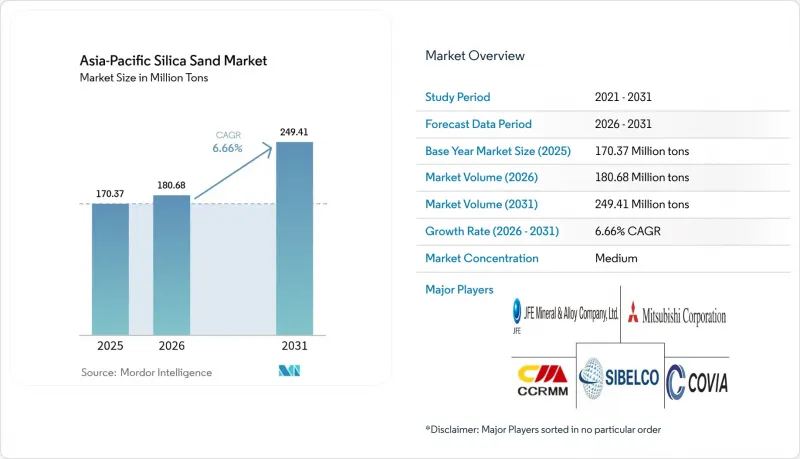
This report is Segmented by Grade (Glass Grade, Foundry/Smelter Grade, and More), End-Use Industry (Glass Manufacturing, Foundry, Chemical, Construction, Ceramics and Refractories, Filtration, and More), and Geography (China, India, Japan, South Korea, Indonesia, Thailand, Malaysia, Singapore, Philippines, Vietnam, and Rest of Asia-Pacific). The Market Forecasts are Provided in Terms of Volume (Tons).
Asia-Pacific Silica Sand Market Trends and Insights
Construction-Led Flat and Container Glass Demand Surge
Flat-glass requirements for skylights, curtain walls, and energy-efficient facades are accelerating across India, Indonesia, Vietnam, and the Philippines as urban rail, airport, and smart-city projects advance. India alone expects flat-glass consumption to top 800 million square meters by 2027 under its Housing for All and Smart Cities programs. Because silica constitutes 60-70% of a float-glass batch, proximity to clean feedstock now dictates furnace siting, leading Thai container-glass makers to secure multi-year supply contracts with integrated silica miners in Chonburi and Rayong. Within ASEAN, more than a dozen metro systems and 18 airport expansions scheduled before 2030 will funnel additional demand into architectural glass, reinforcing the Asia-Pacific silica sand market as the world's most dynamic glass-grade hub.
Rapid Infrastructure Spending Across ASEAN Countries
ASEAN governments allocated USD 13.2 billion to transport corridors, grid upgrades, and municipal water treatment in the first half of 2024, all of which embed silica sand as fine aggregate in concrete and asphalt. Indonesia's Nusantara capital-city build alone is forecast to consume 50 million cubic meters of sand this decade, intensifying enforcement against illegal dredging in the Java Sea. Vietnam's North-South Expressway requires tight gradation control to satisfy long-life pavement standards, steering contractors toward certified quarries that supply washed and size-classified material. The outcome is a consolidation of demand around compliant operators, deepening vertical integration and reinforcing the Asia-Pacific silica sand market as a strategic raw-material backbone for the region's infrastructure ambitions.
Illegal and Unregulated Sand Mining Curbs
India's Supreme Court imposed a nationwide ban on unauthorized river-sand extraction in 2024, redirecting demand toward licensed quarries and boosting landed costs for contractors. Indonesia intensified patrols in the Riau Archipelago, Vietnam canceled 47 licenses, and the Philippines suspended extraction across 12 provinces. As coastal mining faces tighter environmental scrutiny, buyers source inland or import from Australia and Malaysia, raising freight costs yet accelerating formalization across the Asia-Pacific silica sand market.
Other drivers and restraints analyzed in the detailed report include:
- Foundry Revival for EV and Wind-Power Castings
- Shift to Energy-Efficient Low-Iron Solar Glass
- Substitution by Engineered Sand-Free Building Materials
For complete list of drivers and restraints, kindly check the Table Of Contents.
Segment Analysis
Hyper HPQ expanded at an 11.32% CAGR through 2031. It's a 300-500% price premium that reshapes exploration budgets and capital deployment. Glass grade retained 64.41% of 2025 volume, driven by float and container furnaces able to tolerate 300-500 ppm iron, yet solar-glass makers are shifting toward intermediate high-purity sand to lift module efficiency. Exploration now targets pegmatite-hosted quartz veins and high-silica sandstone where lower innate impurities cut processing costs, a strategic shift underscoring how value, not volume, is defining the future Asia-Pacific silica sand market size for upstream investors.
Regulatory standards such as China's GB/T 32649 for high-purity quartz and Japan's JIS R 3503 for optical glass tighten impurity ceilings further. Companies including Xinyi Golden Ruite deploy acid-leaching and flotation in Guangdong, while VRX Silica's Arrowsmith North project focuses on 99.99% SiO2 output for semiconductor crucibles. These investments translate directly into a premium positioning across the Asia-Pacific silica sand market, elevating beneficiation technology to a core competitive differentiator.
Complete Report Scope:
- By Grade
- Glass Grade
- Foundry/Smelter Grade
- Optical Glass Grade
- Intermediate HPQ
- Ultra High HPQ
- Hyper HPQ
- By End-use Industry
- Glass Manufacturing
- Foundry
- Chemical
- Construction
- Paints and Coatings
- Ceramics and Refractories
- Filtration
- Oil and Gas
- Other End-user Industries
- By Geography
- China
- India
- Japan
- South Korea
- Indonesia
- Thailand
- Malaysia
- Singapore
- Philippines
- Vietnam
- Rest of Asia-Pacific
List of Companies Covered in this Report:
- Chongqing Changjiang River Moulding Material Group Co., Ltd.
- Covia Holdings LLC
- Diatreme Resources Limited
- Imerys
- JFE Mineral & Alloy Company,Ltd.
- Mangal Minerals
- Mitsubishi Corporation
- Raghav Productivity Enhancers Limited
- Sibelco
- Tochu Corporation
- Tosoh Silica Corporation
- VRX Silica
- Xinyi Golden Ruite Quartz Materials Co., Ltd
- Xinyi Solar Holdings Limited
Additional Benefits:
- The market estimate (ME) sheet in Excel format
- 3 months of analyst support
TABLE OF CONTENTS
1 Introduction
- 1.1 Study Assumptions and Market Definition
- 1.2 Scope of the Study
2 Research Methodology
3 Executive Summary
4 Market Landscape
- 4.1 Market Overview
- 4.2 Market Drivers
- 4.2.1 Construction-led flat and container glass demand surge
- 4.2.2 Rapid infrastructure spending across ASEAN Countries
- 4.2.3 Foundry revival for EV and wind-power castings
- 4.2.4 Shift to energy-efficient low-iron solar glass
- 4.2.5 Data-center boom: immersion-cooling and thermal-storage grade HP-silica
- 4.3 Market Restraints
- 4.3.1 Illegal and unregulated sand-mining curbs
- 4.3.2 Substitution by engineered sand-free building materials
- 4.3.3 Govt-led consolidation of small mines
- 4.4 Value Chain Analysis
- 4.5 Porter's Five Forces
- 4.5.1 Bargaining Power of Suppliers
- 4.5.2 Bargaining Power of Buyers
- 4.5.3 Threat of New Entrants
- 4.5.4 Threat of Substitutes
- 4.5.5 Degree of Competition
5 Market Size and Growth Forecasts (Volume)
- 5.1 By Grade
- 5.1.1 Glass Grade
- 5.1.2 Foundry/Smelter Grade
- 5.1.3 Optical Glass Grade
- 5.1.4 Intermediate HPQ
- 5.1.5 Ultra High HPQ
- 5.1.6 Hyper HPQ
- 5.2 By End-use Industry
- 5.2.1 Glass Manufacturing
- 5.2.2 Foundry
- 5.2.3 Chemical
- 5.2.4 Construction
- 5.2.5 Paints and Coatings
- 5.2.6 Ceramics and Refractories
- 5.2.7 Filtration
- 5.2.8 Oil and Gas
- 5.2.9 Other End-user Industries
- 5.3 By Geography
- 5.3.1 China
- 5.3.2 India
- 5.3.3 Japan
- 5.3.4 South Korea
- 5.3.5 Indonesia
- 5.3.6 Thailand
- 5.3.7 Malaysia
- 5.3.8 Singapore
- 5.3.9 Philippines
- 5.3.10 Vietnam
- 5.3.11 Rest of Asia-Pacific
6 Competitive Landscape
- 6.1 Market Concentration
- 6.2 Strategic Moves
- 6.3 Market Share(%)/Ranking Analysis
- 6.4 Company Profiles (includes Global level Overview, Market level overview, Core Segments, Financials as available, Strategic Information, Products and Services, and Recent Developments)
- 6.4.1 Chongqing Changjiang River Moulding Material Group Co., Ltd.
- 6.4.2 Covia Holdings LLC
- 6.4.3 Diatreme Resources Limited
- 6.4.4 Imerys
- 6.4.5 JFE Mineral & Alloy Company,Ltd.
- 6.4.6 Mangal Minerals
- 6.4.7 Mitsubishi Corporation
- 6.4.8 Raghav Productivity Enhancers Limited
- 6.4.9 Sibelco
- 6.4.10 Tochu Corporation
- 6.4.11 Tosoh Silica Corporation
- 6.4.12 VRX Silica
- 6.4.13 Xinyi Golden Ruite Quartz Materials Co., Ltd
- 6.4.14 Xinyi Solar Holdings Limited
7 Market Opportunities and Future Outlook
- 7.1 White-space and Unmet-need Assessment

