PUBLISHER: Mordor Intelligence | PRODUCT CODE: 2066727

PUBLISHER: Mordor Intelligence | PRODUCT CODE: 2066727
North America Silica Sand - Market Share Analysis, Industry Trends & Statistics, Growth Forecasts (2026 - 2031)
According to Mordor Intelligence, the north america silica sand market size is projected to expand from 41.12 Million tons in 2025 and 43 Million tons in 2026 to 53.80 Million tons by 2031, registering a CAGR of 4.58% between 2026 to 2031.
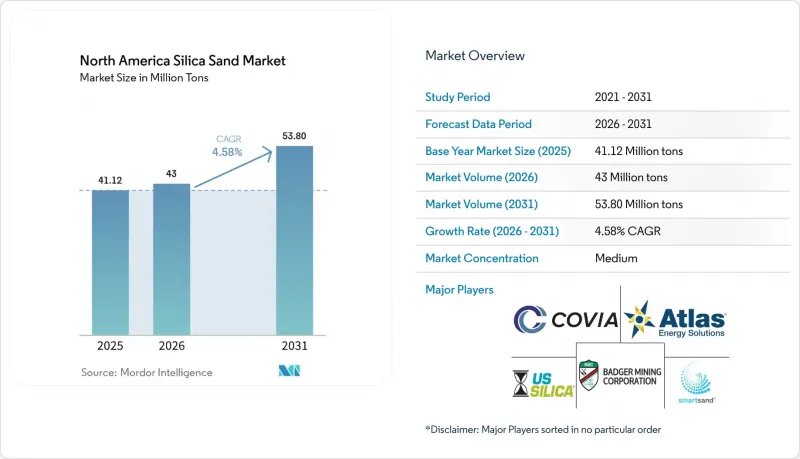
This report is Segmented by End-User Industry (Glass Manufacturing, Foundry, and More), Product Form (Natural Frac Sand, Northern White Sand, and More), Mesh/Grain Size (less Than 70 Mesh, 70-120 Mesh, and More), Processing Method (Wet Silica Sand and Dry and Screened Sand), and Geography (United States, Canada, and Mexico). The Market Forecasts are Provided in Terms of Volume (Tons).
North America Silica Sand Market Trends and Insights
Foundry-Casting Output Recovery
The American Foundry Society projects casting sales to rise 1.9% in 2025 and 4.1% in 2026, then average 4.6% a year to 2030. Forty-one percent of US foundries reported order gains tied to reshoring, and 96% plan capital spending in 2026, signaling sustained silica demand for molds. Foundry-grade sand usage tracks ton-for-ton with ferrous castings, so a USD 52 billion domestic foundry sector concentrated near Midwestern sand deposits cuts inbound freight and tightens supply chains. Smaller shops face higher gas costs that could temper sand intensity if electric-arc melting spreads, yet proximity advantages and rising automotive lightweighting favor steady growth in the North America silica sand market.
Shale Rig-Count Up-Cycle and In-Basin Frac Sand
Permian proppant needs climbed from 14 million tons in 2016 to almost 80 million tons in 2025, equaling 60% of US demand. Lateral lengths now average 10,000-15,000 tons of sand per well, keeping near-term pull firm despite a January 2026 rig count of 546, down 36 year-over-year. In-basin brown sand prices run USD 10-15 per ton below Northern White and meet crush thresholds for moderate depths, spurring capacity additions like Wallstreet Sand's February 2026 Kermit plant. The dynamic compresses rail-delivered margins for Wisconsin mines and drives diversification into industrial niches within the North America silica sand market.
High Logistics-Cost Volatility
Rail rates for SCTG 11 industrial sand move with bulk-commodity cycles, eroding margins for northern mines shipping to Texas and Alberta. PropFlow's wet-sand pipe claims USD 6 per-ton delivery costs yet requires fixed pipelines, limiting uptake. As operators pivot to in-basin dry sand, distant producers either swallow USD 40-60 per-ton rail spreads or pivot into filtration, glass, and specialty grades where quality premiums cover freight. Smaller firms that lack multi-year contracts absorb spot-rate spikes, tightening working capital in the North America silica sand market.
Other drivers and restraints analyzed in the detailed report include:
- Infrastructure-Led Construction Sand Needs
- Semiconductor-Grade HP-Silica Reshoring
- Water-Stress Restrictions in Arid Basins
For complete list of drivers and restraints, kindly check the Table Of Contents.
Segment Analysis
Oil and Gas held 51.89% of the 2025 volume, confirming its anchor role in the North America Silica Sand market share. Filtration and Water Treatment, however, is set to outpace at 5.31% CAGR through 2031 as cities replace aging plants to meet Safe Drinking Water Act thresholds.
Glass manufacturing ranks second, demanding sand above 98% SiO2 and iron below 0.03% Fe2O3, specs that in-basin brown sand rarely meets and which sustain Northern White premiums. Foundry applications were boosted with casting growth tied to automotive lightweighting and reshoring. Chemicals, ceramics, coatings, and niche recreational uses round out demand, each rewarding mesh-size and purity tailoring. The North America silica sand market size allocated to filtration and glass, therefore, looks positioned for consistent expansion, insulating miners from proppant cyclicality.
Northern White supplied 40.88% of 2025 tonnage, anchoring deep-well proppant, glass, and foundry channels. High-purity silica exceeding 99.9% SiO2 will grow 5.51% a year to 2031, buoyed by semiconductor and photovoltaic demand that values tight metal specs.
In-basin brown sand, selling USD 10-15 per ton cheaper, commands a proppant share for moderate depths but remains unsuitable for glass or semiconductor use. Value lies in beneficiation: magnetic separation, flotation, and acid-leach lines upgrade lower-grade feed into glass or high-purity outputs, capturing USD 50-100 per-ton margins. That margin lift shifts revenue mix across the North America silica sand industry even.
List of Companies Covered in this Report:
- AGSCO Corp
- Alpine Silica
- American Silica.
- Atlas Energy Solutions
- Badger Mining Corporation
- Black Mountain Sand
- Capital Sand Company
- CARBO Ceramics Inc.
- Covia Holdings LLC
- Freedom Proppant
- Sibelco
- Signal Peak Silica
- Sil Industrial Minerals
- SiO Silica, Inc.
- SmartSand, Inc.
- Source Energy Services Ltd.
- Superior Silica Sands
- U.S. Silica
Additional Benefits:
- The market estimate (ME) sheet in Excel format
- 3 months of analyst support
TABLE OF CONTENTS
1 Introduction
- 1.1 Study Assumptions and Market Definition
- 1.2 Scope of the Study
2 Research Methodology
3 Executive Summary
4 Market Landscape
- 4.1 Market Overview
- 4.2 Market Drivers
- 4.2.1 Foundry-casting output recovery
- 4.2.2 Shale rig-count up-cycle and in-basin frac sand
- 4.2.3 Infrastructure-led construction sand needs
- 4.2.4 Semiconductor-grade HP-silica reshoring
- 4.2.5 Closed-loop sand-reuse pilots at E&Ps
- 4.3 Market Restraints
- 4.3.1 High logistics-cost volatility
- 4.3.2 Water-stress restrictions in arid basins
- 4.3.3 Cap-ex freeze among Tier-2 drillers
- 4.4 Value Chain Analysis
- 4.5 Porter's Five Forces
- 4.5.1 Bargaining Power of Suppliers
- 4.5.2 Bargaining Power of Buyers
- 4.5.3 Threat of New Entrants
- 4.5.4 Threat of Substitutes
- 4.5.5 Degree of Competition
5 Market Size and Growth Forecasts (Volume)
- 5.1 By End-User Industry
- 5.1.1 Glass Manufacturing
- 5.1.2 Foundry
- 5.1.3 Oil and Gas (Frac/Proppant)
- 5.1.4 Construction Materials
- 5.1.5 Filtration and Water Treatment
- 5.1.6 Chemicals Production
- 5.1.7 Ceramics and Refractories
- 5.1.8 Paints and Coatings
- 5.1.9 Other Niche Uses
- 5.2 By Product Form
- 5.2.1 Natural Frac Sand
- 5.2.2 Northern White Sand
- 5.2.3 In-Basin Brown Sand
- 5.2.4 Glass-Grade Sand
- 5.2.5 Foundry-Grade Sand
- 5.2.6 High-Purity Silica (more than 99.9% SiO2)
- 5.3 By Mesh/Grain Size
- 5.3.1 less than 70 Mesh
- 5.3.2 70-120 Mesh
- 5.3.3 120-200 Mesh
- 5.3.4 more than 200 Mesh
- 5.4 By Processing Method
- 5.4.1 Wet Silic Sand
- 5.4.2 Dry and Screened Sand
- 5.5 By Geography
- 5.5.1 United States
- 5.5.2 Canada
- 5.5.3 Mexico
6 Competitive Landscape
- 6.1 Market Concentration
- 6.2 Strategic Moves
- 6.3 Market Share(%)/Ranking Analysis
- 6.4 Company Profiles (includes Global Overview, Market Overview, Core Segments, Financials, Strategic Information, Products and Services, Recent Developments)
- 6.4.1 AGSCO Corp
- 6.4.2 Alpine Silica
- 6.4.3 American Silica.
- 6.4.4 Atlas Energy Solutions
- 6.4.5 Badger Mining Corporation
- 6.4.6 Black Mountain Sand
- 6.4.7 Capital Sand Company
- 6.4.8 CARBO Ceramics Inc.
- 6.4.9 Covia Holdings LLC
- 6.4.10 Freedom Proppant
- 6.4.11 Sibelco
- 6.4.12 Signal Peak Silica
- 6.4.13 Sil Industrial Minerals
- 6.4.14 SiO Silica, Inc.
- 6.4.15 SmartSand, Inc.
- 6.4.16 Source Energy Services Ltd.
- 6.4.17 Superior Silica Sands
- 6.4.18 U.S. Silica
7 Market Opportunities and Future Outlook
- 7.1 White-space and Unmet-Need Assessment

