PUBLISHER: Mordor Intelligence | PRODUCT CODE: 2121397

PUBLISHER: Mordor Intelligence | PRODUCT CODE: 2121397
Smart Cities - Market Share Analysis, Industry Trends & Statistics, Growth Forecasts (2026 - 2031)
According to Mordor Intelligence, the smart cities market size is valued at USD 1.96 trillion in 2026 and is projected to reach USD 4.06 trillion in 2031, translating into a 15.65% CAGR over the forecast period.
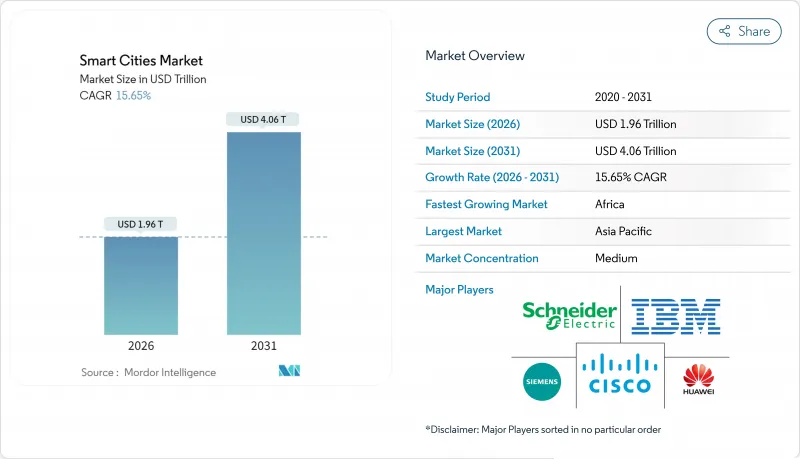
This report is Segmented by Solution (Smart Mobility Management, Smart Public Safety, and More), Component (Hardware, Software, and Services), Deployment Model (Cloud, and On-Premises), End-User (Government and Municipal, Residential, and More), and Geography. The Market Forecasts are Provided in Terms of Value (USD).
Global Smart Cities Market Trends and Insights
Surging Government Funding for Integrated Infrastructure
Multi-modal grant programs are shifting risk from local balance sheets to national budgets. The United States ARPA-I has earmarked USD 2 billion for proof-of-concept projects that combine electric-vehicle charging, smart streetlights and storm-water sensors within shared conduit, cutting installation costs by nearly 40%. The United Kingdom's Local Digital Fund committed GBP 500 million (USD 635 million) in 2025 to standardize application programming interfaces across council services, giving residents single-portal access to parking permits and waste-collection schedules. Japan's Digital Agency allotted USD 1.2 billion to reinforce mid-tier cities with fiber backhaul and edge compute nodes that double as disaster-response hubs. Collectively, these programs accelerate adoption in municipalities that lack bonding authority, smoothing the near-term revenue curve for vendors across the smart cities market.
Rising Adoption of AI and IoT Platforms
Cities are moving from descriptive dashboards to prescriptive analytics that automate resource allocation. Singapore's Smart Nation machine-learning models predicted bus crowding with 92% accuracy in 2025, trimming average commute times by 11 minutes. ITU's Y.4000 standards, ratified in 2024, unlocked true plug-and-play interoperability, letting procurement teams swap out sensors without being locked into monolithic suites. Munich's open-source digital twin processed 2.3 billion sensor readings to optimize snow-removal routes, slashing fuel use by 18% and saving EUR 4.2 million (USD 4.6 million) in overtime. Such examples validate the value proposition and shorten payback periods, spurring incremental demand in the smart cities market.
High Upfront Retrofit and Integration Costs
Legacy assets in mature cities lack spare conduit, power capacity or network backhaul, forcing expensive civil works before sensor rollouts. The American Society of Civil Engineers pegged vehicle-to-infrastructure upgrades at USD 175,000-250,000 per intersection in 2025, roughly four times the greenfield cost. Chicago's smart-streetlight initiative absorbed USD 18 million in unforeseen transformer upgrades, delaying completion by 14 months. Integration complexity further inflates budgets as municipalities translate data from decades-old SCADA systems into cloud-ready formats, often requiring bespoke middleware that adds 15-25% to licensing fees. These barriers can postpone deal closure and slow initial uptake in the smart cities market.
Other drivers and restraints analyzed in the detailed report include:
- Climate-Resilience Mandates Elevating Sensor Deployments
- Data-Driven Urban Services Demand in Megacities
- Cyber-Security and Data-Privacy Concerns
For complete list of drivers and restraints, kindly check the Table Of Contents.
Segment Analysis
Smart utilities represented 28.44% of total revenue in 2025, buoyed by mandates for advanced metering and automated fault isolation. The United States Department of Energy's Grid Resilience and Innovation Partnerships program alone released USD 3.5 billion to projects that demonstrate real-time voltage optimization, slicing outage durations by up to 50%. Smart public safety solutions are set to deliver the fastest 17.24% CAGR, as municipalities deploy interconnected gunshot-detection microphones and AI-based crime prediction. For instance, the Los Angeles Police Department's upgraded real-time crime center cut property-crime response times by 14% in 2025.
Multiple adjacent domains round out the portfolio. Smart mobility takes advantage of Society of Automotive Engineers V2X protocols standardized in 2024, improving traffic-signal coordination and reducing congestion. Smart buildings rely on automated HVAC and occupancy analytics that hit a typical three-year payback. Pilot smart healthcare kiosks in underserved neighborhoods demonstrate early success in trimming emergency-room backlog. Smart security applications address perimeter protection for water-treatment plants and substations, leveraging Transportation Security Administration pipeline directives to justify investment. Together these subcategories reinforce the breadth of the smart cities market.
Hardware commanded 54.46% of 2025 outlays, reflecting the tangible nature of sensors, cameras and edge servers that deliver instant visibility. Bosch magnetometer parking nodes, deployed across 120 cities, cut average parking search time by eight minutes and trimmed local emissions by 2.3% in pilot zones. In contrast, software platforms are forecast to climb at a 16.24% CAGR, as municipalities pivot toward subscription fees that bundle analytics updates and security patches. Microsoft's Azure Digital Twins gave 18 cities the ability to simulate congestion-pricing zones in silico, helping avoid politically risky missteps.
Services bridge the two worlds, especially for smaller municipalities lacking deep IT benches. The Linux Foundation reports 340 municipal installations of its open-source FIWARE and CityGML frameworks as of 2025, up from 210 a year earlier, signaling confidence in community-supported stacks. The shift toward software-defined infrastructure further weakens vendor lock-in, letting cities change analytics vendors without ripping out hardware, a trend that structurally benefits the smart cities market.
Complete Report Scope:
- By Solution
- Smart Mobility Management
- Smart Public Safety
- Smart Healthcare
- Smart Building
- Smart Utilities
- Smart Security
- Other Solutions
- By Component
- Hardware
- Software
- Services
- By Deployment Model
- Cloud
- On-Premise
- By End-User
- Government and Municipal
- Residential
- Commercial and Industrial
- Transportation and Logistics
- Utilities Providers
- Other End-User
- By Geography
- North America
- United States
- Canada
- Mexico
- South America
- Brazil
- Argentina
- Rest of South America
- Europe
- Germany
- United Kingdom
- France
- Italy
- Spain
- Russia
- Rest of Europe
- Asia Pacific
- China
- Japan
- India
- South Korea
- Australia and New Zealand
- Southeast Asia
- Rest of Asia Pacific
- Middle East
- Saudi Arabia
- United Arab Emirates
- Turkey
- Rest of Middle East
- Africa
- South Africa
- Nigeria
- Rest of Africa
- North America
Geography Analysis
Asia Pacific generated 39.58% of smart cities market revenue in 2025, underpinned by China's mandate to establish 500 smart cities by 2030. The Ministry of Housing and Urban-Rural Development requires every city above 1 million residents to operate an integrated command center, accelerating demand for domestic platforms offered by Huawei and Alibaba Cloud. India's Smart Cities Mission disbursed INR 480 billion (USD 5.8 billion) across 100 municipalities, showing measurable congestion reductions of 16% on pilot corridors. Japan's Society 5.0 funded 23 digital-twin pilots in 2025, including a Tokyo model that simulates earthquake evacuations in near real time.
Africa is projected to record an 18.09% CAGR through 2031, the highest worldwide. The African Development Bank's USD 2.5 billion African Urban Agenda prioritizes water-loss detection and prepaid metering. Cape Town's smart water grid plugged leaks fast enough to defer a ZAR 4.2 billion (USD 230 million) desalination plant. Kigali's city-wide IoT backbone, built with Korea Telecom, reduced lighting and waste-collection costs by 12%. These leapfrog deployments validate software-defined infrastructure in bandwidth-constrained environments, propelling the smart cities market across frontier economies.
North America benefits from federal cost-sharing programs but contends with fragmented procurement rules. Europe's focus on open-source and data sovereignty drives uptake of locally hosted clouds, underwritten by the EUR 7.5 billion (USD 8.76 billion) Digital Europe Programme. The Middle East is building showcase greenfield cities such as NEOM that embed autonomous mobility and blockchain land registries from day one. South America relies on concession models; Sao Paulo alone attracted USD 420 million in private capital for smart lighting in 2024. Collectively, these patterns diversify addressable revenue streams, adding resilience to the global smart cities market.
- ABB Ltd.
- Cisco Systems Inc.
- Emerson Electric Co.
- International Business Machines Corporation
- Telefonaktiebolaget LM Ericsson
- Schneider Electric SE
- General Electric Company
- Siemens AG
- Huawei Technologies Co. Ltd.
- Honeywell International Inc.
- Hitachi Ltd.
- Nokia Corporation
- Koninklijke Philips N.V.
- Microsoft Corporation
- Oracle Corporation
- AT&T Inc.
- Intel Corporation
- NEC Corporation
- Robert Bosch GmbH (Bosch Security Systems)
- Samsung Electronics Co. Ltd.
- Panasonic Corporation
- Verizon Communications Inc.
- Alibaba Group Holding Ltd. (Alibaba Cloud)
- Johnson Controls International plc
- Thales Group
Additional Benefits:
- The market estimate (ME) sheet in Excel format
- 3 months of analyst support
TABLE OF CONTENTS
1 INTRODUCTION
- 1.1 Study Assumptions and Market Definition
- 1.2 Scope of the Study
2 RESEARCH METHODOLOGY
3 EXECUTIVE SUMMARY
4 MARKET LANDSCAPE
- 4.1 Market Overview
- 4.2 Market Drivers
- 4.2.1 Surging Government Funding for Integrated Infrastructure
- 4.2.2 Rising Adoption of AI and IoT Platforms
- 4.2.3 Climate-Resilience Mandates Elevating Sensor Deployments
- 4.2.4 Data-Driven Urban Services Demand in Megacities
- 4.2.5 Energy-Positive District Pilots Accelerating Utilities Spend
- 4.2.6 Digital-Twin Adoption Shortening Municipal Procurement Cycles
- 4.3 Market Restraints
- 4.3.1 High Upfront Retrofit and Integration Costs
- 4.3.2 Cyber-Security and Data-Privacy Concerns
- 4.3.3 Municipal Debt-Ceiling Pressure Post-COVID
- 4.3.4 Political Resistance to Urban Surveillance Analytics
- 4.4 Industry Value Chain Analysis
- 4.5 Regulatory Landscape
- 4.6 Technological Outlook
- 4.7 Porter's Five Forces Analysis
- 4.7.1 Bargaining Power of Suppliers
- 4.7.2 Bargaining Power of Buyers
- 4.7.3 Threat of New Entrants
- 4.7.4 Threat of Substitutes
- 4.7.5 Intensity of Competitive Rivalry
- 4.8 Impact of Macroeconomic Factors on the Market
5 MARKET SIZE AND GROWTH FORECASTS (VALUE)
- 5.1 By Solution
- 5.1.1 Smart Mobility Management
- 5.1.2 Smart Public Safety
- 5.1.3 Smart Healthcare
- 5.1.4 Smart Building
- 5.1.5 Smart Utilities
- 5.1.6 Smart Security
- 5.1.7 Other Solutions
- 5.2 By Component
- 5.2.1 Hardware
- 5.2.2 Software
- 5.2.3 Services
- 5.3 By Deployment Model
- 5.3.1 Cloud
- 5.3.2 On-Premise
- 5.4 By End-User
- 5.4.1 Government and Municipal
- 5.4.2 Residential
- 5.4.3 Commercial and Industrial
- 5.4.4 Transportation and Logistics
- 5.4.5 Utilities Providers
- 5.4.6 Other End-User
- 5.5 By Geography
- 5.5.1 North America
- 5.5.1.1 United States
- 5.5.1.2 Canada
- 5.5.1.3 Mexico
- 5.5.2 South America
- 5.5.2.1 Brazil
- 5.5.2.2 Argentina
- 5.5.2.3 Rest of South America
- 5.5.3 Europe
- 5.5.3.1 Germany
- 5.5.3.2 United Kingdom
- 5.5.3.3 France
- 5.5.3.4 Italy
- 5.5.3.5 Spain
- 5.5.3.6 Russia
- 5.5.3.7 Rest of Europe
- 5.5.4 Asia Pacific
- 5.5.4.1 China
- 5.5.4.2 Japan
- 5.5.4.3 India
- 5.5.4.4 South Korea
- 5.5.4.5 Australia and New Zealand
- 5.5.4.6 Southeast Asia
- 5.5.4.7 Rest of Asia Pacific
- 5.5.5 Middle East
- 5.5.5.1 Saudi Arabia
- 5.5.5.2 United Arab Emirates
- 5.5.5.3 Turkey
- 5.5.5.4 Rest of Middle East
- 5.5.6 Africa
- 5.5.6.1 South Africa
- 5.5.6.2 Nigeria
- 5.5.6.3 Rest of Africa
- 5.5.1 North America
6 COMPETITIVE LANDSCAPE
- 6.1 Market Concentration
- 6.2 Strategic Moves
- 6.3 Market Share Analysis
- 6.4 Company Profiles (includes Global level Overview, Market level overview, Core Segments, Financials as available, Strategic Information, Market Rank/Share for key companies, Products and Services, and Recent Developments)
- 6.4.1 ABB Ltd.
- 6.4.2 Cisco Systems Inc.
- 6.4.3 Emerson Electric Co.
- 6.4.4 International Business Machines Corporation
- 6.4.5 Telefonaktiebolaget LM Ericsson
- 6.4.6 Schneider Electric SE
- 6.4.7 General Electric Company
- 6.4.8 Siemens AG
- 6.4.9 Huawei Technologies Co. Ltd.
- 6.4.10 Honeywell International Inc.
- 6.4.11 Hitachi Ltd.
- 6.4.12 Nokia Corporation
- 6.4.13 Koninklijke Philips N.V.
- 6.4.14 Microsoft Corporation
- 6.4.15 Oracle Corporation
- 6.4.16 AT&T Inc.
- 6.4.17 Intel Corporation
- 6.4.18 NEC Corporation
- 6.4.19 Robert Bosch GmbH (Bosch Security Systems)
- 6.4.20 Samsung Electronics Co. Ltd.
- 6.4.21 Panasonic Corporation
- 6.4.22 Verizon Communications Inc.
- 6.4.23 Alibaba Group Holding Ltd. (Alibaba Cloud)
- 6.4.24 Johnson Controls International plc
- 6.4.25 Thales Group
7 MARKET OPPORTUNITIES AND FUTURE OUTLOOK
- 7.1 White-Space and Unmet-Need Assessment

