PUBLISHER: Mordor Intelligence | PRODUCT CODE: 2121586

PUBLISHER: Mordor Intelligence | PRODUCT CODE: 2121586
Xylene - Market Share Analysis, Industry Trends & Statistics, Growth Forecasts (2026 - 2031)
According to Mordor Intelligence, the xylene market size is estimated at 53.12 Million tons in 2026, and is expected to reach 65 Million tons by 2031, at a CAGR of 4.12% during the forecast period (2026-2031).
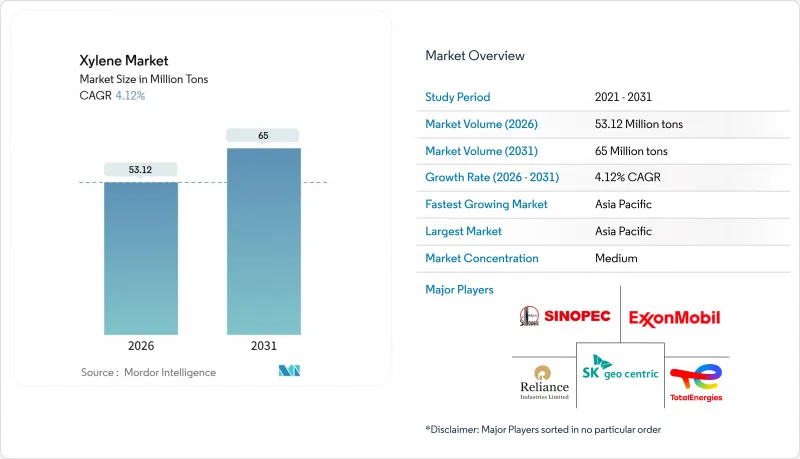
This report is Segmented by Type (Ortho-Xylene, Meta-Xylene, and More), Grade (Technical Grade and High-Purity Grade), Source (Petroleum-Based and Bio-Based), Application (Solvents, Monomer, and Other Applications), End-User Industry (Plastics and Polymers, Paints and Coatings, and More), and Geography (Asia-Pacific, North America, Europe, and More). The Market Forecasts are Provided in Terms of Volume (Tons).
Global Xylene Market Trends and Insights
Surging PET and Polyester Fiber Demand (PX-PTA Value Chain)
Sustained growth in PET packaging and polyester textiles continues to amplify upstream para-xylene requirements. Sinopec Yizheng's 3.0 million-ton per annum PTA unit and SASA Polyester's 1.75 million-ton facility in Turkey, both started in 2024, anchor this linkage. Asia's PET consumption climbed 4% to 88 million tons in 2023 as Indonesia, Vietnam, and Thailand posted double-digit gains, while India's PET demand surged 13% in the same year. Yet China's vast slate of PTA and PET capacity - roughly 71 million tons by 2022 - has created local overcapacity, compressing PX margins and prompting plant closures in Japan and Europe.
Capacity Expansions in Integrated Aromatics Complexes (Middle East and Asia)
Crude-to-chemicals configurations bypass traditional refinery bottlenecks and yield up to 40% aromatics. Saudi Aramco and Sinopec's planned Yanbu complex will add 1.5 million tons per annum of aromatics by 2030. ChemOne Malaysia's USD 3.5 billion Pengerang project, scheduled for 2028 completion, exemplifies this greenfield wave. Hengli Petrochemical and Zhejiang Petroleum & Chemical already operate mega-sites that are redrawing global trade flows and pushing Chinese ortho-xylene into export markets.
Stringent VOC Norms Limiting Aromatic Solvent Use in Europe and North America
The EU's CLP Regulation 2024/2865 and the UK's Environmental Permitting framework impose tighter exposure limits and digital labeling for xylene-containing formulations. Small formulators face higher compliance costs, accelerating reformulation toward water-borne coatings and exempt solvents, while U.S. NESHAP rules add permitting burdens.
Other drivers and restraints analyzed in the detailed report include:
- Automotive Lightweighting Boosting Engineering Plastics (North America)
- Strategic Stockpiling of Solvents by Pharma Amid Supply-Chain Shocks
- Health-Toxicity Concerns Prompting Shift to Oxygenated Solvents
For complete list of drivers and restraints, kindly check the Table Of Contents.
Segment Analysis
Para-xylene retained a commanding 90.12% xylene market share in 2025 owing to its direct conversion into PTA and the downstream polyester chain. Mixed additions in China and the Middle East keep para-xylene margins volatile, yet absolute volumes grow in tandem with PET. Ortho-xylene, despite a 4.11% forecast CAGR, grapples with phthalic anhydride utilization near 57% and plant closures such as Koppers' Stickney site. Meta-xylene demand remains niche, focused on isophthalic acid and high-performance fibers, and suffered from Mitsubishi Gas Chemical's Rotterdam shutdown in 2025.
Overcapacity in ortho-xylene is most acute in China, where domestic supply displaced imports, sending exports up 29.4% year-on-year in 2024. Meta-xylene prices followed mixed-xylene declines, pushing producers out of the value chain. Para-xylene, by contrast, benefits from new PTA plants across Asia and Turkey, maintaining the growth engine for the xylene market.
Technical grade held 85.33% share in 2025, addressing bulk solvents, coatings, and agrochemicals. High-purity grade expands at 4.78% through 2031 as chip fabrication shifts to India and Southeast Asia, requiring sub-ppm impurity specifications. India's USD 10 billion semiconductor incentive drives local high-purity solvent demand.
Regulatory constraints in Europe and North America weigh on technical-grade growth, steering formulators toward water-borne systems. Pharmaceutical synthesis also favors reagent-grade material to satisfy FDA and EMA solvent limits, locking in premiums of 15-25% over industrial grades.
Complete Report Scope:
- By Type
- Ortho-xylene
- Meta-xylene
- Para-xylene
- Mixed xylene
- By Grade
- Technical Grade
- High-Purity Grade (99.9 %)
- By Source
- Petroleum-based Xylene
- Bio-based Xylene
- By Application
- Solvents
- Monomer
- Other Applications
- By End-user Industry
- Plastics and Polymers
- Paints and Coatings
- Adhesives
- Other End-user Industries
- Geography
- Asia-Pacific
- China
- India
- Japan
- South Korea
- Rest of Asia-Pacific
- North America
- United States
- Canada
- Mexico
- Europe
- Germany
- United Kingdom
- France
- Italy
- Rest of Europe
- South America
- Brazil
- Argentina
- Rest of South America
- Middle-East and Africa
- Saudi Arabia
- South Africa
- Rest of Middle-East and Africa
- Asia-Pacific
Geography Analysis
Asia-Pacific held 55.22% xylene market share in 2025 and is projected to grow at 4.55% through 2031. Massive expansions such as Zhejiang Petroleum & Chemical's 11.8 million-ton aromatics hub and Hengli Petrochemical's 4.5 million-ton PX unit underscore the region's dominance. India's Jamnagar complex and Malaysia's Pengerang project deepen regional self-sufficiency.
North America benefits from shale-gas economics but adds minimal new xylene capacity. Gulf Coast complexes remain supply linchpins, though growth prospects rest on engineering-plastics demand linked to electric vehicles. Europe, grappling with high energy costs and stricter environmental rules, has shuttered roughly 14 million tons of aromatics capacity since 2023.
The Middle East leverages low-cost feedstocks to mount export-oriented capacity. Saudi Aramco and Sinopec's Yanbu build-out exemplifies the region's strategic push to capture value along the aromatics chain. South America and Africa remain small contributors, with domestic supply largely meeting local demand.
- Braskem
- Chevron Phillips Chemical Company LLC
- China Petrochemical Corporation
- CNPC
- ENEOS Corporation
- Exxon Mobil Corporation
- Formosa Chemicals & Fibre Corp
- FUJAN REFINING & PETROCHEMICAL COMPANY LIMITED
- GS Caltex Corporation
- Indian Oil Corporation Ltd
- INEOS AG
- LOTTE Chemical Corporation
- Mangalore Refinery and Petrochemicals limited
- MITSUBISHI GAS CHEMICAL COMPANY, INC.
- Mitsui Chemicals, Inc.
- Petro Rabigh
- PTT Global Chemical Public Company Limited
- QatarEnergy
- Reliance Industries Limited
- SK Geocentric Co., Ltd.
- S-OIL CORPORATION
- TotalEnergies
Additional Benefits:
- The market estimate (ME) sheet in Excel format
- 3 months of analyst support
TABLE OF CONTENTS
1 Introduction
- 1.1 Study Assumptions and Market Definition
- 1.2 Scope of the Study
2 Research Methodology
3 Executive Summary
4 Market Landscape
- 4.1 Market Overview
- 4.2 Market Drivers
- 4.2.1 Surging PET and Polyester Fibre Demand (PX-PTA Value Chain)
- 4.2.2 Capacity Expansions in Integrated Aromatics Complexes (Mideast and Asia)
- 4.2.3 Automotive Lightweighting Boosting Engineering Plastics (North America)
- 4.2.4 Strategic Stockpiling of Solvents by Pharma Amid Supply-Chain Shocks
- 4.2.5 Carbon-Aware Procurement by Brand-Owners Favouring Bio-Xylene Blends
- 4.3 Market Restraints
- 4.3.1 Stringent VOC Norms Limiting Aromatic Solvent Use in Europe and North America
- 4.3.2 Health-toxicity Concerns Prompting Shift to Oxygenated Solvents
- 4.3.3 Volatile Naphtha Prices Compressing Producer Margins
- 4.4 Value Chain Analysis
- 4.5 Porter's Five Forces Analysis
- 4.5.1 Bargaining Power of Suppliers
- 4.5.2 Bargaining Power of Buyers
- 4.5.3 Threat of New Entrants
- 4.5.4 Threat of Substitutes
- 4.5.5 Degree of Competition
5 Market Size and Growth Forecasts (Volume)
- 5.1 By Type
- 5.1.1 Ortho-xylene
- 5.1.2 Meta-xylene
- 5.1.3 Para-xylene
- 5.1.4 Mixed xylene
- 5.2 By Grade
- 5.2.1 Technical Grade
- 5.2.2 High-Purity Grade (99.9 %)
- 5.3 By Source
- 5.3.1 Petroleum-based Xylene
- 5.3.2 Bio-based Xylene
- 5.4 By Application
- 5.4.1 Solvents
- 5.4.2 Monomer
- 5.4.3 Other Applications
- 5.5 By End-user Industry
- 5.5.1 Plastics and Polymers
- 5.5.2 Paints and Coatings
- 5.5.3 Adhesives
- 5.5.4 Other End-user Industries
- 5.6 Geography
- 5.6.1 Asia-Pacific
- 5.6.1.1 China
- 5.6.1.2 India
- 5.6.1.3 Japan
- 5.6.1.4 South Korea
- 5.6.1.5 Rest of Asia-Pacific
- 5.6.2 North America
- 5.6.2.1 United States
- 5.6.2.2 Canada
- 5.6.2.3 Mexico
- 5.6.3 Europe
- 5.6.3.1 Germany
- 5.6.3.2 United Kingdom
- 5.6.3.3 France
- 5.6.3.4 Italy
- 5.6.3.5 Rest of Europe
- 5.6.4 South America
- 5.6.4.1 Brazil
- 5.6.4.2 Argentina
- 5.6.4.3 Rest of South America
- 5.6.5 Middle-East and Africa
- 5.6.5.1 Saudi Arabia
- 5.6.5.2 South Africa
- 5.6.5.3 Rest of Middle-East and Africa
- 5.6.1 Asia-Pacific
6 Competitive Landscape
- 6.1 Market Concentration
- 6.2 Strategic Moves
- 6.3 Market Share(%)/Ranking Analysis
- 6.4 Company Profiles {(includes Global level Overview, Market level overview, Core Segments, Financials as available, Strategic Information, Products and Services, and Recent Developments)}
- 6.4.1 Braskem
- 6.4.2 Chevron Phillips Chemical Company LLC
- 6.4.3 China Petrochemical Corporation
- 6.4.4 CNPC
- 6.4.5 ENEOS Corporation
- 6.4.6 Exxon Mobil Corporation
- 6.4.7 Formosa Chemicals & Fibre Corp
- 6.4.8 FUJAN REFINING & PETROCHEMICAL COMPANY LIMITED
- 6.4.9 GS Caltex Corporation
- 6.4.10 Indian Oil Corporation Ltd
- 6.4.11 INEOS AG
- 6.4.12 LOTTE Chemical Corporation
- 6.4.13 Mangalore Refinery and Petrochemicals limited
- 6.4.14 MITSUBISHI GAS CHEMICAL COMPANY, INC.
- 6.4.15 Mitsui Chemicals, Inc.
- 6.4.16 Petro Rabigh
- 6.4.17 PTT Global Chemical Public Company Limited
- 6.4.18 QatarEnergy
- 6.4.19 Reliance Industries Limited
- 6.4.20 SK Geocentric Co., Ltd.
- 6.4.21 S-OIL CORPORATION
- 6.4.22 TotalEnergies
7 Market Opportunities and Future Outlook
- 7.1 White-space and Unmet-need Assessment

