PUBLISHER: Mordor Intelligence | PRODUCT CODE: 2121820

PUBLISHER: Mordor Intelligence | PRODUCT CODE: 2121820
Glass Fiber - Market Share Analysis, Industry Trends & Statistics, Growth Forecasts (2026 - 2031)
According to Mordor Intelligence, the glass fiber market size is expected to grow from 8.44 million tons in 2025 to 8.79 million tons in 2026 and is forecast to reach 10.75 million tons by 2031 at a 4.12% CAGR over 2026-2031.
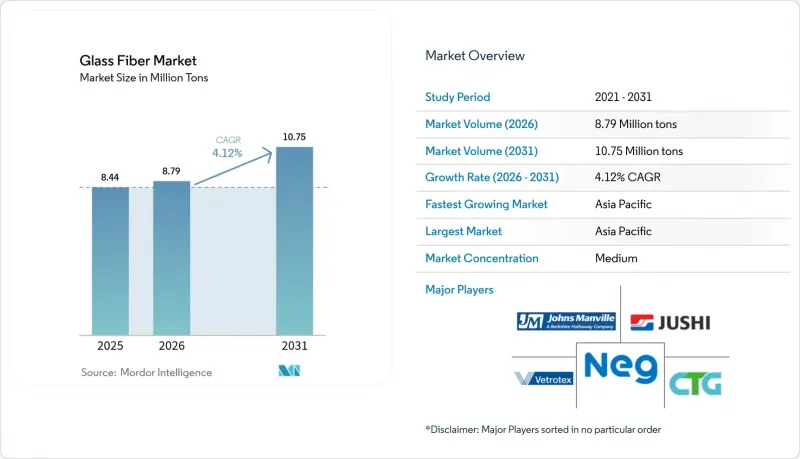
This report is Segmented by Product Form (Roving, Mats, Strands, Yarn, and More), Fiber Type (E-Glass, S-Glass, E-CR Glass, C-Glass, and Others), End-User Industry (Building and Construction, Automotive, Wind Energy, Aerospace and Defense, Marine, and More), and Geography (Asia-Pacific, North America, Europe, South America, Middle East and Africa). The Market Forecasts are Provided in Terms of Volume (Tons).
Global Glass Fiber Market Trends and Insights
Post-Pandemic Construction Boom in Asia Bolsters Demand for Glass-Wool Insulation
India allocated USD 120 billion to infrastructure in fiscal 2025, and nearly half of that spending went into residential projects where glass-wool batts are now required by the 2024 Energy Conservation Building Code. Vietnam's construction sector advanced 9.1% in 2025, with foreign-invested factories specifying clean-room insulation that relies on low-density glass wool. Indonesia earmarked IDR 410 trillion (USD 27 billion) for 2025 infrastructure, using glass-wool products that cut cooling loads by up to 35% in tropical housing. Malaysia and Thailand show parallel trends as data-center and cold-chain investors adopt higher R-value batts to meet ASHRAE 90.1 targets. Collectively, these programs keep Asia the anchor of glass fiber market growth.
EV Lightweighting Accelerates Adoption of Chopped-Strand Composites
Global battery-electric vehicle production hit 14.2 million units in 2025, a 19% jump over 2024 that propelled composite demand. Tesla's Model Y uses chopped-strand mat structures to trim body-in-white mass by 23%, translating into an 18 km range extension per charge. BYD, Volkswagen, and General Motors each validated glass-fiber-reinforced thermoplastics for battery trays, together saving more than USD 300 per vehicle against aluminum alternatives. As automakers push toward cost-parity EVs, volume contracts for chopped strands underpin a steady mid-single-digit rise in the glass fiber market.
Carbon-Fiber Price Erosion Narrows Glass-Fiber's Cost Advantage
Toray, Mitsubishi Chemical, and SGL Carbon added a combined 9,500 tons of carbon-fiber nameplate capacity during 2025, pushing average prices down to USD 16.30 per kilogram. Automotive compounds now see a cost gap of only 2X versus glass-fiber polypropylene, compared with 2.4X in 2023. Sporting goods OEMs are piloting lower-cost shafts that could siphon mid-tier volumes away from E-Glass. Absent countermeasures, this trend trims the glass fiber market growth trajectory.
Other drivers and restraints analyzed in the detailed report include:
- Mega-Scale Wind-Turbine Blades Expand Roving Consumption
- EU and North-American Retrofit Energy Codes Mandate Additional Insulation
- Rock-Wool Producers Target Less Than 100 kg/m3 HVAC Niche
For complete list of drivers and restraints, kindly check the Table Of Contents.
Segment Analysis
Roving contributed 33.45% to 2025 volume and is on track for 4.41% CAGR through 2031, outpacing the broader glass fiber market because each 15 MW offshore turbine consumes 35 tons of unidirectional material. Mats follow, anchored in automotive underbody panels and marine laminates produced in low-cost Chinese and Turkish yards. Glass wool receives a tailwind from retrofit mandates across Europe and North America. Strands, yarns, and the "others" cluster supply printed-circuit boards, filtration textiles, and specialty adhesives, but direct-roving pultrusion is cannibalizing intermediate formats.
Roving's installed base benefits from process improvements that cut cycle time in automotive compression molding to four minutes, half that of chopped-strand mats. Glass-wool producers are lowering binder content to 3%, improving R-value, and meeting VOC limits in California. Milled fiber remains a rheology modifier in sealants, whereas woven fabrics secure aerospace tooling demand. All told, diversified applications shield the glass fiber industry against single-segment swings.
Complete Report Scope:
- By Product Form
- Roving
- Mats
- Strands
- Yarn
- Glass Wool
- Others (Milled Fiber and Fabrics)
- By Fiber Type
- E-Glass
- S-Glass
- E-CR Glass
- C-Glass
- Others
- By End-user Industry
- Building and Construction
- Automotive
- Wind Energy
- Aerospace and Defense
- Marine
- Sports and Leisure
- Other End-user Industries (Electronics)
- By Geography
- Asia-Pacific
- China
- India
- Japan
- South Korea
- Indonesia
- Vietnam
- Malaysia
- Thailand
- Rest of Asia-Pacific
- North America
- United States
- Canada
- Mexico
- Europe
- Germany
- France
- United Kingdom
- Italy
- Spain
- Russia
- Turkey
- Nordics
- Rest of Europe
- South America
- Brazil
- Argentina
- Colombia
- Rest of South America
- Middle-East and Africa
- Saudi Arabia
- United Arab Emirates
- Qatar
- Egypt
- South Africa
- Nigeria
- Rest of Middle-East and Africa
- Asia-Pacific
Geography Analysis
Asia-Pacific dominated the glass fiber market with 49.81% of 2025 volume and is slated for a 4.57% CAGR to 2031. India alone absorbed 1.8 million tons, up 19% year-on-year, as developers met strengthened thermal codes. China produced 5.2 million tons but exported 38%, reflecting persistent overcapacity and aggressive outbound logistics. Vietnam's 1.2 GW of 2025 wind builds needed 9,600 tons of roving, while Indonesia's EV-motorcycle boom raised composite consumption in two-wheel battery enclosures.
North America accounted for a significant market share in 2025. The U.S. installed 12 GW of wind capacity under Inflation Reduction Act incentives, translating into 96,000 tons of roving demand. Canada's Greener Homes Grant installed 180,000 retrofit kits dominated by glass wool, and Mexico produced 3.8 million vehicles using composites in 28% of units.
Europe accounted for significant glass fiber consumption in 2025, with Germany, France, and the U.K. making up 58%. Germany's 420,000 home retrofits drew heavily on glass-wool batts, whereas France added 2.1 GW of wind that required 16,800 tons of roving. The U.K. saw automotive softness but aerospace upside as Airbus raised A320neo wing set output. South America and the Middle East-Africa together are witnessing the rising demand driven by Brazil's 2.3 million-unit auto fleet and Saudi Arabia's hydrogen pipelines that consume 12,000 tons of E-CR glass.
- 3B - the fibreglass company
- AGY
- ASAHI FIBER GLASS Co., Ltd
- China Jushi Co., Ltd.
- Chongqing International Composite Materials Co., Ltd.
- Envalior
- Gurit Services AG
- Heraeus Holding
- Johns Manville
- Nippon Electric Glass Co., Ltd.
- PFG FIBER GLASS CORPORATION
- Praana Group
- Saint-Gobain
- Taishan Fiberglass Inc.(CTG)
- Taiwan Glass Ind. Corp.
Additional Benefits:
- The market estimate (ME) sheet in Excel format
- 3 months of analyst support
TABLE OF CONTENTS
1 Introduction
- 1.1 Study Assumptions and Market Definition
- 1.2 Scope of the Study
2 Research Methodology
3 Executive Summary
4 Market Landscape
- 4.1 Market Overview
- 4.2 Market Drivers
- 4.2.1 Post-pandemic construction boom in Asia bolsters demand for glass-wool insulation
- 4.2.2 EV lightweighting accelerates adoption of chopped-strand composites
- 4.2.3 Mega-scale wind-turbine blades expand roving consumption
- 4.2.4 EU and North-American retrofit energy codes mandate additional insulation
- 4.2.5 Hydrogen pipeline projects specify E-CR glass for chemical resistance
- 4.3 Market Restraints
- 4.3.1 Carbon-fiber price erosion narrows glass-fiber's cost advantage
- 4.3.2 Rock-wool producers target Less Than 100 kg m-3 HVAC niche
- 4.3.3 Volatile soda-ash and energy costs crimp Chinese furnace margins
- 4.4 Value Chain Analysis
- 4.5 Porter's Five Forces
- 4.5.1 Bargaining Power of Suppliers
- 4.5.2 Bargaining Power of Consumers
- 4.5.3 Threat of New Entrants
- 4.5.4 Threat of Substitute Products
- 4.5.5 Degree of Competition
5 Market Size and Growth Forecasts (Volume)
- 5.1 By Product Form
- 5.1.1 Roving
- 5.1.2 Mats
- 5.1.3 Strands
- 5.1.4 Yarn
- 5.1.5 Glass Wool
- 5.1.6 Others (Milled Fiber and Fabrics)
- 5.2 By Fiber Type
- 5.2.1 E-Glass
- 5.2.2 S-Glass
- 5.2.3 E-CR Glass
- 5.2.4 C-Glass
- 5.2.5 Others
- 5.3 By End-user Industry
- 5.3.1 Building and Construction
- 5.3.2 Automotive
- 5.3.3 Wind Energy
- 5.3.4 Aerospace and Defense
- 5.3.5 Marine
- 5.3.6 Sports and Leisure
- 5.3.7 Other End-user Industries (Electronics)
- 5.4 By Geography
- 5.4.1 Asia-Pacific
- 5.4.1.1 China
- 5.4.1.2 India
- 5.4.1.3 Japan
- 5.4.1.4 South Korea
- 5.4.1.5 Indonesia
- 5.4.1.6 Vietnam
- 5.4.1.7 Malaysia
- 5.4.1.8 Thailand
- 5.4.1.9 Rest of Asia-Pacific
- 5.4.2 North America
- 5.4.2.1 United States
- 5.4.2.2 Canada
- 5.4.2.3 Mexico
- 5.4.3 Europe
- 5.4.3.1 Germany
- 5.4.3.2 France
- 5.4.3.3 United Kingdom
- 5.4.3.4 Italy
- 5.4.3.5 Spain
- 5.4.3.6 Russia
- 5.4.3.7 Turkey
- 5.4.3.8 Nordics
- 5.4.3.9 Rest of Europe
- 5.4.4 South America
- 5.4.4.1 Brazil
- 5.4.4.2 Argentina
- 5.4.4.3 Colombia
- 5.4.4.4 Rest of South America
- 5.4.5 Middle-East and Africa
- 5.4.5.1 Saudi Arabia
- 5.4.5.2 United Arab Emirates
- 5.4.5.3 Qatar
- 5.4.5.4 Egypt
- 5.4.5.5 South Africa
- 5.4.5.6 Nigeria
- 5.4.5.7 Rest of Middle-East and Africa
- 5.4.1 Asia-Pacific
6 Competitive Landscape
- 6.1 Market Concentration
- 6.2 Strategic Moves
- 6.3 Market Share(%)/Ranking Analysis
- 6.4 Company Profiles (includes Global Overview, Market Overview, Core Segments, Financials, Strategic Information, Products and Services, Recent Developments)
- 6.4.1 3B - the fibreglass company
- 6.4.2 AGY
- 6.4.3 ASAHI FIBER GLASS Co., Ltd
- 6.4.4 China Jushi Co., Ltd.
- 6.4.5 Chongqing International Composite Materials Co., Ltd.
- 6.4.6 Envalior
- 6.4.7 Gurit Services AG
- 6.4.8 Heraeus Holding
- 6.4.9 Johns Manville
- 6.4.10 Nippon Electric Glass Co., Ltd.
- 6.4.11 PFG FIBER GLASS CORPORATION
- 6.4.12 Praana Group
- 6.4.13 Saint-Gobain
- 6.4.14 Taishan Fiberglass Inc.(CTG)
- 6.4.15 Taiwan Glass Ind. Corp.
7 Market Opportunities and Future Outlook
- 7.1 White-space and Unmet-need Assessment

