PUBLISHER: Mordor Intelligence | PRODUCT CODE: 2121842

PUBLISHER: Mordor Intelligence | PRODUCT CODE: 2121842
Complex Event Processing - Market Share Analysis, Industry Trends & Statistics, Growth Forecasts (2026 - 2031)
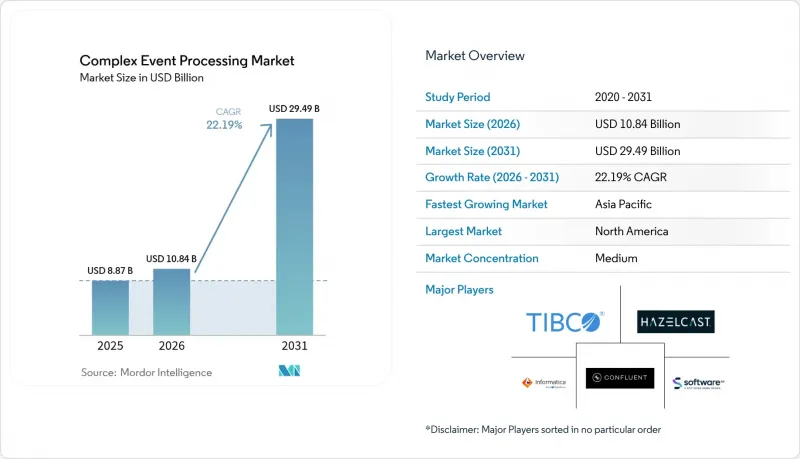
According to Mordor Intelligence, the complex event processing market size is expected to grow from USD 8.87 billion in 2025 to USD 10.84 billion in 2026 and is forecast to reach USD 29.49 billion by 2031 at 22.19% CAGR over 2026-2031.
This report is Segmented by Component (Platforms, Software Tools, and Services), Deployment Mode (Cloud, On-Premises, and Hybrid), Application (Fraud Detection, Network Monitoring, Algorithmic Trading, Predictive Maintenance, and More), Industry Vertical (Banking Financial Services and Insurance, Telecommunications, and More), and Geography. The Market Forecasts are Provided in Terms of Value (USD).
Global Complex Event Processing Market Trends and Insights
Rising Adoption of Event-Driven Microservices Architectures
Firms decomposing monoliths into containerized workloads notice that synchronous REST calls propagate latency and cascading failure. Publishing events to durable logs lets downstream services replay missed data after recovery, trimming mean time to recovery and boosting resilience. Goldman Sachs disclosed that its event-driven settlement platform shortened equity trade clearance time by 40% compared with message-queue predecessors. Kubernetes-native operators such as Strimzi automate cluster rollout, yet tuning partitions, replication factors and consumer offsets still demands scarce distributed-systems expertise. As additional industries embrace microservices, steady demand for elastic, exactly-once pipelines sustains growth in the complex event processing market.
Escalating IoT-Generated Data Volumes in Industrial Settings
A modern automotive plant emits nearly 2 terabytes of real-time telemetry per day, overwhelming nightly ETL windows. Lightweight edge processors detect robotic welder temperatures that drift 3 °C above spec, enabling corrections before defects propagate. Siemens reported a 25% cut in unplanned downtime and EUR 18 million (USD 19.4 million) cost avoidance once vibration streams flowed into predictive algorithms. Edge gateways filter noise and forward only anomalies, conserving bandwidth and keeping response below 100 milliseconds. The surging sensor footprint anchors long-run momentum for the complex event processing market.
Shortage of Skilled Stream-Processing Engineers
Universities rarely teach event-time semantics, watermark strategies or partition-rebalance theory, forcing firms to rely on consultants or lengthy internal boot camps. A 2024 Confluent survey found 68% of data leaders citing talent scarcity as the top adoption barrier. Roles stay unfilled for six months or longer in many metros, inflating project budgets and delaying production timelines. Managed services partly mask complexity, yet boards remain cautious about outsourcing mission-critical event flows, prolonging the constraint.
Other drivers and restraints analyzed in the detailed report include:
- Integration of AI and ML for Real-Time Predictive Analytics
- Surge in Instant Fraud Detection Requirements Across BFSI
- Legacy System Integration Complexity in Large Enterprises
For complete list of drivers and restraints, kindly check the Table Of Contents.
Segment Analysis
Services generated 36.28% revenue in 2025, underscoring that architecture design, Kubernetes tuning and schema governance require expert support. Complex event processing market size for services is set to climb at a 23.08% CAGR through 2031 as enterprises engage system integrators to unify SCADA feeds, IoT telemetry and transactional databases. Typical engagements last 6-12 months and exceed USD 500,000, a billable base that dwarfs license fees. Platforms, including commercial Kafka, Flink, and vendor-specific engines, retain a healthy share; however, commoditization rises as hyperscalers integrate managed streaming into broader cloud bundles. Ancillary developer tools face even stronger price pressure because open-source dashboards and CLIs replicate core functionality.
Despite margin compression, platforms still matter. Enterprises standardizing on Apache Kafka or Pulsar treat the event backbone as foundational, allocating multiyear budgets for global replication, disaster recovery and exactly-once guarantees. Software tooling focuses on developer productivity, schema registries, IDE plugins, lineage trackers, but seldom represents more than 10% of annual spend. The defensibility of services therefore strengthens. Compliance audits, zero-trust security reviews and performance retuning under scaling load all demand human oversight, keeping services as the most reliable contributor to the complex event processing market.
Cloud accounted for 55.62% revenue in 2025 as AWS Managed Streaming for Apache Kafka, Azure Event Hubs and Google Pub/Sub removed the toil of provisioning clusters. Usage-based pricing benefits spiky workloads that spike during product launches or flash sales, and auto-scaling curbs idle spend. Yet telecom operators and capital-market venues with steady high throughput report monthly cloud bills topping USD 50,000, nudging repatriation to on-premises Kubernetes. Complex event processing market share for hybrid architectures will expand fastest at 23.10% because regulated industries need both sovereign control and elastic analytics.
Hybrid design creates complexity. Enterprises must synchronize ACLs, security tokens and schemas between plant-floor clusters and cloud data lakes. European NIS2 cybersecurity rules push critical-infrastructure operators to keep raw events inside national borders. Vendors respond by shipping cluster-aware connectors that propagate only sanitized aggregates across jurisdictional boundaries. Over the forecast horizon, the complex event processing market will witness cloud providers doubling down on managed connectors that ease hybrid orchestration, while hardware OEMs integrate lightweight Kafka nodes into industrial gateways to guarantee sub-10-millisecond latency at the edge.
Complete Report Scope:
- By Component
- Platforms
- Software Tools
- Services
- By Deployment Mode
- Cloud
- On-Premises
- Hybrid
- By Application
- Fraud Detection
- Network Monitoring
- Algorithmic Trading
- Predictive Maintenance
- Sales and Marketing
- Other Application
- By Industry Vertical
- Banking, Financial Services and Insurance
- Telecommunications
- Retail and E-Commerce
- Manufacturing
- Healthcare
- Government and Defense
- Energy and Utilities
- Other Industry Vertical
- By Geography
- North America
- United States
- Canada
- Mexico
- Europe
- Germany
- United Kingdom
- France
- Italy
- Rest of Europe
- Asia-Pacific
- China
- Japan
- India
- South Korea
- Australia
- Rest of Asia-Pacific
- Middle East and Africa
- Middle East
- Saudi Arabia
- United Arab Emirates
- Rest of Middle East
- Africa
- South Africa
- Egypt
- Rest of Africa
- Middle East
- South America
- Brazil
- Argentina
- Rest of South America
- North America
Geography Analysis
North America controlled 37.62% revenue in 2025 thanks to Wall Street trading firms and Silicon Valley technology giants that pioneered algorithmic trading, fraud detection and clickstream personalization. Venture investors funneled billions into Confluent, Imply and Materialize, building a deep engineering talent pool. The California Consumer Privacy Act pushes real-time anonymization pipelines, expanding addressable demand. Yet a shortage of distributed-systems engineers remains acute, inflating salaries and delaying project start dates. Mid-market adopters often choose managed services to sidestep the talent gap, fueling service-provider growth inside the complex event processing market.
Asia Pacific registers the fastest growth at 23.48% CAGR through 2031. Chinese smart-city programs instrument traffic lights, utility meters and surveillance cameras, streaming petabytes of events to command centers. India's Unified Payments Interface processed 11.4 billion transactions in October 2024, requiring sub-second clearing and fraud detection. Japanese factories automate predictive maintenance to offset workforce aging, and South Korean carriers use 5G network slicing that depends on real-time resource allocation. Sovereign data laws such as China's PIPL force in-country clusters, raising duplicate infrastructure costs but simultaneously boosting local vendor revenues, further enlarging the complex event processing market.
Europe benefits from automotive telematics and industrial IoT rollouts in Germany, France and Sweden. GDPR, NIS2 and the pending AI Act impose strict lineage and consent obligations that favor platforms capably tracking every event transformation. Middle East smart-city megaprojects in Dubai and Saudi Arabia rely on streaming analytics to route traffic and optimize energy grids. Africa remains nascent yet shows promise through mobile-money ecosystems that transfer micro-payments in near real time. South America concentrates activity in Brazil, where banks deploy CEP engines to combat Pix payment fraud. Overall, regional variances in regulation, connectivity and industrial maturity ensure a diverse demand landscape that enriches the complex event processing market.
- Confluent, Inc.
- TIBCO Software Inc.
- Software AG
- Informatica Inc.
- Hazelcast, Inc.
- SAS Institute Inc.
- EsperTech, Inc.
- Striim, Inc.
- StreamSets, Inc.
- Impetus Technologies, Inc.
- Nastel Technologies, Inc.
- WSO2 LLC
- Red Hat, Inc.
- Cloudera, Inc.
- Amazon Web Services, Inc.
- IBM Corporation
- Oracle Corporation
- Google LLC
- Hitachi Vantara LLC
- Imply Data, Inc.
- Kafkaesque Technologies Ltd.
- Bentley Systems, Incorporated
Additional Benefits:
- The market estimate (ME) sheet in Excel format
- 3 months of analyst support
TABLE OF CONTENTS
1 INTRODUCTION
- 1.1 Study Assumptions and Market Definition
- 1.2 Scope of the Study
2 RESEARCH METHODOLOGY
3 EXECUTIVE SUMMARY
4 MARKET LANDSCAPE
- 4.1 Market Overview
- 4.2 Market Drivers
- 4.2.1 Rising Adoption of Event-Driven Microservices Architectures
- 4.2.2 Escalating IoT-Generated Data Volumes in Industrial Settings
- 4.2.3 Integration of AI and ML for Real-Time Predictive Analytics
- 4.2.4 Surge in Instant Fraud Detection Requirements Across BFSI
- 4.2.5 Expansion of Edge Computing for Ultra-Low Latency Processing
- 4.2.6 Venture Capital Inflows into Pure-Play Stream Processing Start-Ups
- 4.3 Market Restraints
- 4.3.1 Shortage of Skilled Stream-Processing Engineers
- 4.3.2 Legacy System Integration Complexity in Large Enterprises
- 4.3.3 Data Sovereignty and Privacy Compliance Hurdles
- 4.3.4 High Cloud Consumption Costs for High-Throughput Workloads
- 4.4 Industry Value Chain Analysis
- 4.5 Regulatory Landscape
- 4.6 Technological Outlook
- 4.7 Porter's Five Forces Analysis
- 4.7.1 Threat of New Entrants
- 4.7.2 Bargaining Power of Suppliers
- 4.7.3 Bargaining Power of Buyers
- 4.7.4 Threat of Substitutes
- 4.7.5 Competitive Rivalry
- 4.8 Impact of Macroeconomic Factors
5 MARKET SIZE AND GROWTH FORECASTS (VALUE)
- 5.1 By Component
- 5.1.1 Platforms
- 5.1.2 Software Tools
- 5.1.3 Services
- 5.2 By Deployment Mode
- 5.2.1 Cloud
- 5.2.2 On-Premises
- 5.2.3 Hybrid
- 5.3 By Application
- 5.3.1 Fraud Detection
- 5.3.2 Network Monitoring
- 5.3.3 Algorithmic Trading
- 5.3.4 Predictive Maintenance
- 5.3.5 Sales and Marketing
- 5.3.6 Other Application
- 5.4 By Industry Vertical
- 5.4.1 Banking, Financial Services and Insurance
- 5.4.2 Telecommunications
- 5.4.3 Retail and E-Commerce
- 5.4.4 Manufacturing
- 5.4.5 Healthcare
- 5.4.6 Government and Defense
- 5.4.7 Energy and Utilities
- 5.4.8 Other Industry Vertical
- 5.5 By Geography
- 5.5.1 North America
- 5.5.1.1 United States
- 5.5.1.2 Canada
- 5.5.1.3 Mexico
- 5.5.2 Europe
- 5.5.2.1 Germany
- 5.5.2.2 United Kingdom
- 5.5.2.3 France
- 5.5.2.4 Italy
- 5.5.2.5 Rest of Europe
- 5.5.3 Asia-Pacific
- 5.5.3.1 China
- 5.5.3.2 Japan
- 5.5.3.3 India
- 5.5.3.4 South Korea
- 5.5.3.5 Australia
- 5.5.3.6 Rest of Asia-Pacific
- 5.5.4 Middle East and Africa
- 5.5.4.1 Middle East
- 5.5.4.1.1 Saudi Arabia
- 5.5.4.1.2 United Arab Emirates
- 5.5.4.1.3 Rest of Middle East
- 5.5.4.2 Africa
- 5.5.4.2.1 South Africa
- 5.5.4.2.2 Egypt
- 5.5.4.2.3 Rest of Africa
- 5.5.4.1 Middle East
- 5.5.5 South America
- 5.5.5.1 Brazil
- 5.5.5.2 Argentina
- 5.5.5.3 Rest of South America
- 5.5.1 North America
6 COMPETITIVE LANDSCAPE
- 6.1 Market Concentration
- 6.2 Strategic Moves
- 6.3 Market Share Analysis
- 6.4 Company Profiles (includes Global Level Overview, Market Level Overview, Core Segments, Financials as Available, Strategic Information, Market Rank/Share for Key Companies, Products and Services, and Recent Developments)
- 6.4.1 Confluent, Inc.
- 6.4.2 TIBCO Software Inc.
- 6.4.3 Software AG
- 6.4.4 Informatica Inc.
- 6.4.5 Hazelcast, Inc.
- 6.4.6 SAS Institute Inc.
- 6.4.7 EsperTech, Inc.
- 6.4.8 Striim, Inc.
- 6.4.9 StreamSets, Inc.
- 6.4.10 Impetus Technologies, Inc.
- 6.4.11 Nastel Technologies, Inc.
- 6.4.12 WSO2 LLC
- 6.4.13 Red Hat, Inc.
- 6.4.14 Cloudera, Inc.
- 6.4.15 Amazon Web Services, Inc.
- 6.4.16 IBM Corporation
- 6.4.17 Oracle Corporation
- 6.4.18 Google LLC
- 6.4.19 Hitachi Vantara LLC
- 6.4.20 Imply Data, Inc.
- 6.4.21 Kafkaesque Technologies Ltd.
- 6.4.22 Bentley Systems, Incorporated
7 MARKET OPPORTUNITIES AND FUTURE OUTLOOK
- 7.1 White-Space and Unmet-Need Assessment

