PUBLISHER: Mordor Intelligence | PRODUCT CODE: 2121860

PUBLISHER: Mordor Intelligence | PRODUCT CODE: 2121860
Orthopedic Devices - Market Share Analysis, Industry Trends & Statistics, Growth Forecasts (2026 - 2031)
According to Mordor Intelligence, the orthopedic devices market size was valued at USD 59.97 billion in 2025 and is estimated to grow from USD 62.89 billion in 2026 to reach USD 78.89 billion by 2031, at a CAGR of 4.64% during the forecast period (2026-2031).
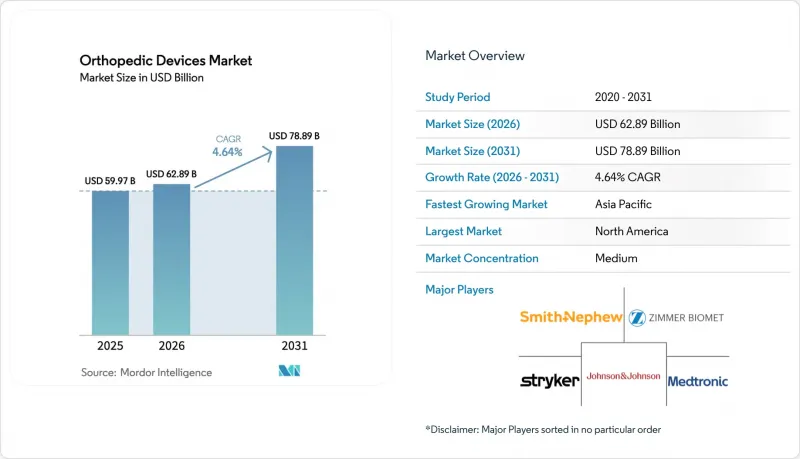
This report is Segmented by Product Type (Joint Replacement Implants, Spinal Implants, Trauma Fixation Devices, Sports Medicine Devices, and More), Technology (Conventional, 3-D Printed Patient-Specific Implants, and More), End User (Hospitals, ASC, Specialty Clinics, and More), and Geography (North America, Europe, Asia-Pacific, MEA, South America). Market Forecasts are Provided in Terms of Value (USD).
Global Orthopedic Devices Market Trends and Insights
Aging Global Population & Osteoarthritis Prevalence
The orthopedic devices market benefits structurally from demographic aging. The World Health Organization estimates that by 2030, 1 in 6 people will be 60 years or older, rising to 2.1 billion by 2050. Osteoarthritis already affects 595 million individuals and is increasing at the fastest rate in East Asia and Western Europe. Japan and South Korea post the steepest per-capita implant demand, yet keep reimbursement ceilings tight, prompting tiered product portfolios. China's elderly population concentrates in tier-1 and tier-2 cities, where private hospitals command premium pricing, while public tenders favor economical domestic implants. Companies that flex their production cost structures to match both channels limit cannibalization and preserve their margins.
Technological Advancement in Robotic Surgery & 3-D Printing
Robotics has shifted from pilot programs to a procurement prerequisite in many high-volume centers. Zimmer Biomet's ROSA Shoulder and Johnson & Johnson's VELYS platforms joined Stryker's Mako and Smith & Nephew's Cori in 2024, broadening indications from knees and hips to shoulders and partials. Hospitals negotiate bundled robot-implant contracts that lock in multiyear volume, anchoring the orthopedic devices market around integrated ecosystems. Meanwhile, 3-D printing progressed from guides to load-bearing implants; 3D Systems secured clearance for a titanium ankle cage with lattice structures that enhance bone ingrowth. Distributed additive manufacturing trims inventory yet requires ISO 13485-graded quality controls at local print hubs.
High Device Cost & Reimbursement Gaps
Out-of-pocket spending in emerging markets still exceeds 40%, making advanced implants unaffordable for a large population segment. Brazil's public system reimburses only BRL 3,000 (approximately USD 600) per knee implant, compared to retail prices of BRL 10,000-15,000 (approximately USD 2,000-3,000). U.S. Medicare reduced total knee arthroplasty payments by 2% in 2025, shifting leverage to group purchasing organizations. Manufacturers respond with stripped-down lines for price-sensitive regions, although gray-market diversion poses a risk to channel conflict.
Other drivers and restraints analyzed in the detailed report include:
- Expansion of Ambulatory Surgical Centers
- Cost-Effective Domestic Innovation via Asia Volume-Based Procurement
- Stringent Regulatory Approvals & Product Recalls
For complete list of drivers and restraints, kindly check the Table Of Contents.
Segment Analysis
Orthobiologics outpace the broader orthopedic devices market with a 10.22% CAGR through 2031, gaining traction in spinal fusion and trauma grafting. Joint replacement implants still accounted for the largest share of the orthopedic devices market size at 35.78% in 2025; however, their growth is moderating as mature geographies plateau and price pressure intensifies. Knee implants dominate the market due to the prevalence of osteoarthritis, while reverse total shoulder systems increase the share of the shoulder segment. Manufacturers are pivoting toward ceramic-on-polyethylene bearings in hips to address past concerns with metal-on-metal bearings. Ankle arthroplasty remains a niche procedure, but it is gaining traction thanks to additive-manufactured patient-specific components, such as Paragon 28's APEX 3D cage.
Surgeons increasingly pair demineralized bone matrix with synthetic substitutes to minimize harvest-site morbidity, thereby amplifying the penetration of orthobiologics. Trauma fixation, fuelled by motorcycle injuries in Asia and sports accidents in North America, adds steady volume, though hospitals bargain aggressively on commodity screws and plates. Spinal implants are categorized into fusion cages and motion-preserving discs, with younger patients generally opting for the latter. Sports-medicine devices, especially bioabsorbable anchors, are riding the trend of active aging. Collectively, these shifts redistribute the orthopedic devices market share toward biologics and high-margin soft-tissue solutions.
Complete Report Scope:
- By Product Type
- Joint Replacement Implants
- Knee Implants
- Hip Implants
- Shoulder Implants
- Ankle Implants
- Spinal Implants
- Fusion Devices
- Non-fusion Devices
- Trauma Fixation Devices
- Plates & Screws
- Intramedullary Nails
- External Fixators
- Sports Medicine Devices
- Arthroscopy Devices
- Soft-Tissue Repair Implants
- Orthobiologics
- Demineralized Bone Matrix
- Synthetic Bone Substitutes
- Stem-Cell Therapy Products
- Other Product Type
- Joint Replacement Implants
- By Technology
- Conventional Implants
- 3-D Printed Patient-specific Implants
- Robotic-Assisted & Navigation Systems
- Smart Sensor-Enabled Implants
- AI-Driven Planning & Measurement Tools
- By End User
- Hospitals
- Ambulatory Surgical Centers
- Specialty Orthopedic Clinics
- Home & Rehabilitation Settings
- By Geography
- North America
- United States
- Canada
- Mexico
- Europe
- Germany
- United Kingdom
- France
- Italy
- Spain
- Rest of Europe
- Asia-Pacific
- China
- Japan
- India
- Australia
- South Korea
- Rest of Asia-Pacific
- Middle East & Africa
- GCC
- South Africa
- Rest of Middle East & Africa
- South America
- Brazil
- Argentina
- Rest of South America
- North America
Geography Analysis
North America generated 42.64% of the global revenue in 2025 and remains the most significant contributor to the orthopedic devices market in terms of value. Medicare's 2025 2% payment cut for total knee arthroplasty tightened hospital margins, prompting faster migration to ASCs and sharpening negotiations with suppliers. Canada's single-payer model caps implant prices and lengthens waitlists, while Mexico builds medical tourism hubs that lure U.S. patients seeking cost relief.
Europe is shaped by MDR bottlenecks that delay new launches and amplify compliance costs, particularly in Germany, the continent's largest market. The United Kingdom's National Health Service limits uptake of premium robotics pending conclusive cost-effectiveness data. Southern Europe's fiscal constraints hinder capital budgets, even as private insurers in Spain and Italy expand coverage. Eastern Europe is pressing for affordable conventional implants, whereas Nordic countries are investing in digital health infrastructure, integrating remote monitoring into joint-replacement pathways.
Asia Pacific is the fastest-growing geography, with an 8.76% CAGR through 2031, driven by China's volume-based tenders and India's expanding middle class, along with streamlining at the CDSCO. Japan's aging demographic sustains demand for hip and knee replacements despite stringent domestic trial requirements, while Australia's Therapeutic Goods Administration mirrors FDA standards, serving as a test launch pad. South Korea channels public grants into AI-guided surgery pilots. The Middle East and Africa register uneven progress, with Gulf Cooperation Council nations investing in world-class orthopedics, South Africa balancing a public-private split, and the remainder of the region constrained by reimbursement gaps. South America sees Brazil driving volume but battling affordability, whereas Colombia and Chile gain from insurance penetration. Together, these developments redistribute the orthopedic devices market share toward high-population, value-oriented buyers.
- Arthrex
- B. Braun Melsungen AG (Aesculap)
- Conmed
- Enovis (formerly DJO Global)
- Exactech
- Globus Medical (NuVasive Inc.)
- Integra LifeSciences
- Johnson & Johnson
- LimaCorporate
- Medtronic
- MicroPort Orthopedics
- Orthofix
- Ossur
- Paragon 28
- Seaspine
- Smiths Group
- Spineart
- Stryker
- Wright Medical Group
- Zimmer Biomet
Additional Benefits:
- The market estimate (ME) sheet in Excel format
- 3 months of analyst support
TABLE OF CONTENTS
1 Introduction
- 1.1 Study Assumptions & Market Definition
- 1.2 Scope of the Study
2 Research Methodology
3 Executive Summary
4 Market Landscape
- 4.1 Market Overview
- 4.2 Market Drivers
- 4.2.1 Aging Global Population & Osteoarthritis Prevalence
- 4.2.2 Rising Sports Injuries & Trauma Incidents
- 4.2.3 Technological Advancement in Robotic Surgery & 3-D Printing
- 4.2.4 Expansion of Ambulatory Surgical Centers
- 4.2.5 AI-Enabled Smart Implants & Data-Driven Alignment
- 4.2.6 Cost-Effective Domestic Innovation Via Asia Volume-Based Procurement
- 4.3 Market Restraints
- 4.3.1 High Device Cost & Reimbursement Gaps
- 4.3.2 Stringent Regulatory Approvals & Product Recalls
- 4.3.3 Critical Raw-Material Bottlenecks (Titanium, PEEK, Ceramics)
- 4.3.4 Algorithmic Bias & Cyber-Risk Slowing AI-Device Clearances
- 4.4 Regulatory Landscape
- 4.5 Technological Outlook
- 4.6 Porter's Five Forces Analysis
- 4.6.1 Threat of New Entrants
- 4.6.2 Bargaining Power of Buyers
- 4.6.3 Bargaining Power of Suppliers
- 4.6.4 Threat of Substitutes
- 4.6.5 Competitive Rivalry
5 Market Size & Growth Forecasts
- 5.1 By Product Type
- 5.1.1 Joint Replacement Implants
- 5.1.1.1 Knee Implants
- 5.1.1.2 Hip Implants
- 5.1.1.3 Shoulder Implants
- 5.1.1.4 Ankle Implants
- 5.1.2 Spinal Implants
- 5.1.2.1 Fusion Devices
- 5.1.2.2 Non-fusion Devices
- 5.1.3 Trauma Fixation Devices
- 5.1.3.1 Plates & Screws
- 5.1.3.2 Intramedullary Nails
- 5.1.3.3 External Fixators
- 5.1.4 Sports Medicine Devices
- 5.1.4.1 Arthroscopy Devices
- 5.1.4.2 Soft-Tissue Repair Implants
- 5.1.5 Orthobiologics
- 5.1.5.1 Demineralized Bone Matrix
- 5.1.5.2 Synthetic Bone Substitutes
- 5.1.5.3 Stem-Cell Therapy Products
- 5.1.6 Other Product Type
- 5.1.1 Joint Replacement Implants
- 5.2 By Technology
- 5.2.1 Conventional Implants
- 5.2.2 3-D Printed Patient-specific Implants
- 5.2.3 Robotic-Assisted & Navigation Systems
- 5.2.4 Smart Sensor-Enabled Implants
- 5.2.5 AI-Driven Planning & Measurement Tools
- 5.3 By End User
- 5.3.1 Hospitals
- 5.3.2 Ambulatory Surgical Centers
- 5.3.3 Specialty Orthopedic Clinics
- 5.3.4 Home & Rehabilitation Settings
- 5.4 By Geography
- 5.4.1 North America
- 5.4.1.1 United States
- 5.4.1.2 Canada
- 5.4.1.3 Mexico
- 5.4.2 Europe
- 5.4.2.1 Germany
- 5.4.2.2 United Kingdom
- 5.4.2.3 France
- 5.4.2.4 Italy
- 5.4.2.5 Spain
- 5.4.2.6 Rest of Europe
- 5.4.3 Asia-Pacific
- 5.4.3.1 China
- 5.4.3.2 Japan
- 5.4.3.3 India
- 5.4.3.4 Australia
- 5.4.3.5 South Korea
- 5.4.3.6 Rest of Asia-Pacific
- 5.4.4 Middle East & Africa
- 5.4.4.1 GCC
- 5.4.4.2 South Africa
- 5.4.4.3 Rest of Middle East & Africa
- 5.4.5 South America
- 5.4.5.1 Brazil
- 5.4.5.2 Argentina
- 5.4.5.3 Rest of South America
- 5.4.1 North America
6 Competitive Landscape
- 6.1 Market Concentration
- 6.2 Market Share Analysis
- 6.3 Company Profiles (includes Global Level Overview, Market Level Overview, Core Segments, Financials as Available, Strategic Information, Market Rank/Share for Key Companies, Products & Services, and Recent Developments)
- 6.3.1 Arthrex Inc.
- 6.3.2 B. Braun Melsungen AG (Aesculap)
- 6.3.3 Conmed Corporation
- 6.3.4 Enovis (formerly DJO Global)
- 6.3.5 Exactech
- 6.3.6 Globus Medical (NuVasive Inc.)
- 6.3.7 Integra LifeSciences
- 6.3.8 Johnson & Johnson (DePuy Synthes)
- 6.3.9 LimaCorporate
- 6.3.10 Medtronic
- 6.3.11 MicroPort Orthopedics
- 6.3.12 Orthofix Medical Inc.
- 6.3.13 Ossur
- 6.3.14 Paragon 28
- 6.3.15 SeaSpine
- 6.3.16 Smith & Nephew plc
- 6.3.17 Spineart SA
- 6.3.18 Stryker Corporation
- 6.3.19 Wright Medical
- 6.3.20 Zimmer Biomet Holdings Inc.
7 Market Opportunities & Future Outlook
- 7.1 White-space & Unmet-Need Assessment

