PUBLISHER: Mordor Intelligence | PRODUCT CODE: 2121876

PUBLISHER: Mordor Intelligence | PRODUCT CODE: 2121876
Polyacrylamide - Market Share Analysis, Industry Trends & Statistics, Growth Forecasts (2026 - 2031)
According to Mordor Intelligence, the polyacrylamide market size is expected to increase from 2.32 million tons in 2025 to 2.45 million tons in 2026 and reach 3.25 million tons by 2031, growing at a CAGR of 5.81% over 2026-2031.
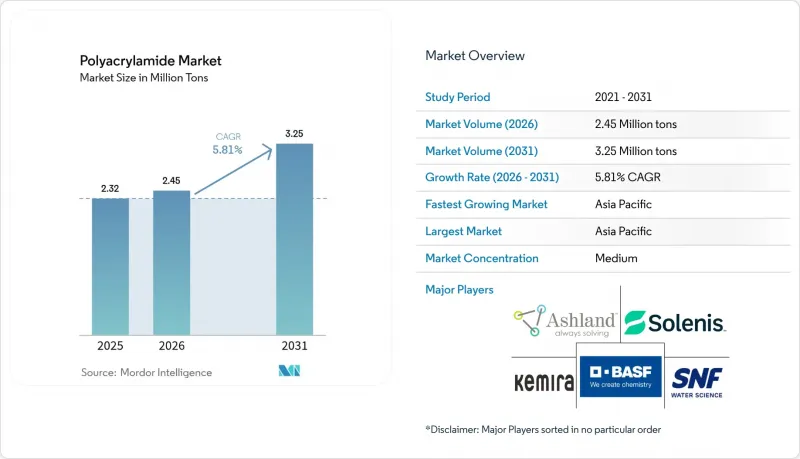
This report is Segmented by Physical Form (Powder, Liquid, and Emulsion/Dispersions), Application (Enhanced Oil Recovery, Flocculants for Water Treatment, Soil Conditioner, and More), End-User Industry (Water Treatment, Oil and Gas, Pulp and Paper, and More), and Geography (Asia-Pacific, North America, Europe, South America, and Middle-East and Africa). The Market Forecasts are Provided in Terms of Volume (Tons).
Global Polyacrylamide Market Trends and Insights
Growing Utilization in Enhanced Oil Recovery
Polymer flooding now targets deeper, hotter, and saltier reservoirs, prompting a pivot from standard hydrolyzed polyacrylamide to ATBS-copolymer blends stable above 120°C and at 200,000 ppm salinity. National oil companies favor EOR because it lifts recovery factors by 5%-15% without frontier exploration. Selective gel-placement technologies that pair polyacrylamide with chromium or organic cross-linkers further reduce water cut, extend well life, and defer abandonment costs. These dual pathways are expected to raise polymer demand per barrel recovered and reinforce the value of ultra-high-molecular-weight grades. Consequently, EOR's share of the polyacrylamide market is climbing faster than any other application, reshaping supplier portfolios toward higher-margin specialty products.
Rising Demand for Flocculants in Municipal & Industrial Wastewater Treatment
The EU Urban Wastewater Treatment Directive lowered the tertiary-treatment threshold from 10,000 to 1,000 population equivalents, compelling widespread clarifier and centrifuge upgrades. Municipal biosolids typically rely on cationic polyacrylamide at 40%-60% charge density, while Asian textile effluents need 80% charge to capture anionic dyes. India's Central Pollution Control Board requires sludge for cement-kiln co-processing to reach below 20% moisture by 2026, pushing polymer doses above 5 kg per dry tonne. China's drive to incinerate or pyrolyze municipal sludge also hinges on achieving 40% solids, a benchmark attainable only with high-dose polyacrylamide treatment. Global procurement agencies are shifting to performance-based contracts, pressuring suppliers to deliver polymers that hit dewatering targets without overdosing penalties.
Health & Carcinogenicity Concerns Over Residual Acrylamide Monomer
WHO lists acrylamide as a probable human carcinogen, while ATSDR highlights neurotoxicity at chronic exposures above 0.5 mg/kg day. The US EPA caps residual monomer at 0.05% in polymers used for drinking-water treatment and limits the dose to 1 mg/l. Meeting these limits requires vacuum-distillation or reactive-precipitation stripping units that add USD 200-400/t to production costs. Premium grades certified under NSF/ANSI 60 now command price premiums of 10%-20%, fragmenting the polyacrylamide market between certified and non-certified tiers. Non-compliant shipments have already faced rejections in Australia and New Zealand, prompting importers to demand supplier certification.
Other drivers and restraints analyzed in the detailed report include:
- Expansion of Mining Activities Driving Demand for Sedimentation Aids
- Shift Toward Ultra-High-Molecular-Weight Friction Reducers for Shale Completions
- Rising Preference for Bio-Based Flocculants in Europe
For complete list of drivers and restraints, kindly check the Table Of Contents.
Segment Analysis
Powder grades accounted for 43.80% of the polyacrylamide market share in 2025, serving price-sensitive municipal and mining customers that have existing dissolution tanks. Emulsion formats, typically 30%-40% active solids, dissolve in under five minutes and eliminate dust exposure, a decisive benefit after OSHA cut the permissible acrylamide dust limit to 0.03 mg m-3 in 2024. The segment is forecast to grow at 6.12% annually through 2031, raising its slice of the polyacrylamide market size as automation and real-time dosing spread across mining and offshore platforms.
Emulsions command 10%-20% price premiums over powders but cut labor, dissolution energy, and overdosing losses, often lowering the total cost of ownership. SNF's 2024 expansion in Lara, Australia, added 5,000 t y-1 of emulsion capacity to meet mining demand, reflecting supplier bets on this shift. Liquid grades at 10%-15% solids address cosmetics and small wastewater plants that prioritize storage simplicity. Legacy powder users in Asia-Pacific and Latin America still favor USD <2,000/t pricing, yet as safety and productivity metrics grow stricter, powder's dominance will erode in favor of safer, faster-diluting formats.
Complete Report Scope:
- By Physical Form
- Powder
- Liquid
- Emulsion/Dispersion
- By Application
- Flocculants for Water Treatment
- Enhanced Oil Recovery
- Soil Conditioner
- Binders and Stabilizers in Cosmetics
- Other Applications (Mining & Mineral Processing etc.)
- By End-User Industry
- Water Treatment
- Oil and Gas
- Mining
- Pulp & Paper
- Other End-user Industries (Chemicals & Petrochemicals, etc.)
- By Geography
- Asia-Pacific
- China
- India
- Japan
- South Korea
- Malaysia
- Thailand
- Indonesia
- Vietnam
- Rest of Asia-Pacific
- North America
- United States
- Canada
- Mexico
- Europe
- Germany
- United Kingdom
- France
- Italy
- Spain
- Nordic Countries
- Turkey
- Russia
- Rest of Europe
- South America
- Brazil
- Argentina
- Colombia
- Rest of South America
- Middle East & Africa
- Saudi Arabia
- Qatar
- United Arab Emirates
- Nigeria
- Egypt
- South Africa
- Rest of Middle-East and Africa
- Asia-Pacific
Geography Analysis
Asia-Pacific held 49.95% of the polyacrylamide market share in 2025 and will grow at 6.25% through 2031, buoyed by semiconductor expansion, 16 million t of new containerboard capacity, and battery supply-chain investments in Indonesia, Malaysia, and Thailand. China produced 55 million wet tons of municipal sludge in 2025, driving dewatering polymer demand, while India's Swachh Bharat 2.0 targets full sludge processing by 2026, spurring cationic doses above 5 kg/t. Japan, South Korea, and Singapore are drafting polymer-particle discharge limits that could reshape product certification requirements region-wide.
North America shows divergent patterns: hydraulic fracturing consumed 75,000 t of polyacrylamide in 2025, and suppliers such as SNF ramped up integrated monomer-polymer capacity in Louisiana to serve shale and municipal clients. Pulp-paper polymer volumes slid as graphic mills closed or shifted to packaging, but industrial wastewater upgrades and microplastic regulations in California and Canada partially offset the decline. Certified low-monomer grades command premiums, segmenting the market along NSF accreditation lines.
Europe's growth is tied to Directive 2024/3019, which forces tertiary treatment and microplastic monitoring by 2029. Cationic polyacrylamide demand is climbing for sludge dewatering, yet parallel biodegradability mandates are steering procurement toward hybrid and bio-based alternatives. Kemira and Solenis are investing in renewable-polymer capacity to retain share, while regional incentives favor suppliers with demonstrable life-cycle advantages.
- AnHui JuCheng Fine Chemicals Co. Ltd
- Anhui Tianrun Chemical Industry Co. Ltd
- Ashland
- BASF
- Beijing Hengju Chemical Group Co. Ltd
- Beijing Xitao Technology Development Co. Ltd
- CHINAFLOC
- Envitech Chemical Specialities Pvt. Ltd
- Kemira
- Liaocheng Yongxing Environmental Protection Science & Technology Co. Ltd
- Qingdao Oubo Chemical Co. Ltd
- Shandong Tongli Chemical Co. Ltd
- SNF
- Solenis
- Syensqo
- Universal Fine Chemicals SPC
- Yixing Cleanwater Chemicals Co. Ltd
Additional Benefits:
- The market estimate (ME) sheet in Excel format
- 3 months of analyst support
TABLE OF CONTENTS
1 Introduction
- 1.1 Study Assumptions & Market Definition
- 1.2 Scope of the Study
2 Research Methodology
3 Executive Summary
4 Market Landscape
- 4.1 Market Overview
- 4.2 Market Drivers
- 4.2.1 Growing utilisation in enhanced oil recovery (EOR)
- 4.2.2 Rising demand for flocculants in municipal & industrial wastewater treatment
- 4.2.3 Expansion of mining activities driving demand for sedimentation aids
- 4.2.4 Shift toward ultra-high-molecular-weight friction reducers for shale completions
- 4.2.5 Surge in demand for biodegradable PAM grades in precision agriculture
- 4.3 Market Restraints
- 4.3.1 Health & carcinogenicity concerns over residual acrylamide monomer
- 4.3.2 Rising preference for bio-based flocculants in Europe
- 4.3.3 Growing regulatory pressure on polymer micro-particle discharge into surface waters
- 4.4 Value Chain Analysis
- 4.5 Porter's Five Forces
- 4.5.1 Bargaining Power of Suppliers
- 4.5.2 Bargaining Power of Buyers
- 4.5.3 Threat of New Entrants
- 4.5.4 Threat of Substitutes
- 4.5.5 Competitive Rivalry
5 Market Size & Growth Forecasts (Volume)
- 5.1 By Physical Form
- 5.1.1 Powder
- 5.1.2 Liquid
- 5.1.3 Emulsion/Dispersion
- 5.2 By Application
- 5.2.1 Flocculants for Water Treatment
- 5.2.2 Enhanced Oil Recovery
- 5.2.3 Soil Conditioner
- 5.2.4 Binders and Stabilizers in Cosmetics
- 5.2.5 Other Applications (Mining & Mineral Processing etc.)
- 5.3 By End-User Industry
- 5.3.1 Water Treatment
- 5.3.2 Oil and Gas
- 5.3.3 Mining
- 5.3.4 Pulp & Paper
- 5.3.5 Other End-user Industries (Chemicals & Petrochemicals, etc.)
- 5.4 By Geography
- 5.4.1 Asia-Pacific
- 5.4.1.1 China
- 5.4.1.2 India
- 5.4.1.3 Japan
- 5.4.1.4 South Korea
- 5.4.1.5 Malaysia
- 5.4.1.6 Thailand
- 5.4.1.7 Indonesia
- 5.4.1.8 Vietnam
- 5.4.1.9 Rest of Asia-Pacific
- 5.4.2 North America
- 5.4.2.1 United States
- 5.4.2.2 Canada
- 5.4.2.3 Mexico
- 5.4.3 Europe
- 5.4.3.1 Germany
- 5.4.3.2 United Kingdom
- 5.4.3.3 France
- 5.4.3.4 Italy
- 5.4.3.5 Spain
- 5.4.3.6 Nordic Countries
- 5.4.3.7 Turkey
- 5.4.3.8 Russia
- 5.4.3.9 Rest of Europe
- 5.4.4 South America
- 5.4.4.1 Brazil
- 5.4.4.2 Argentina
- 5.4.4.3 Colombia
- 5.4.4.4 Rest of South America
- 5.4.5 Middle East & Africa
- 5.4.5.1 Saudi Arabia
- 5.4.5.2 Qatar
- 5.4.5.3 United Arab Emirates
- 5.4.5.4 Nigeria
- 5.4.5.5 Egypt
- 5.4.5.6 South Africa
- 5.4.5.7 Rest of Middle-East and Africa
- 5.4.1 Asia-Pacific
6 Competitive Landscape
- 6.1 Market Concentration
- 6.2 Strategic Moves
- 6.3 Market Share(%)/Ranking Analysis
- 6.4 Company Profiles (includes Global level Overview, Market level overview, Core Segments, Financials as available, Strategic Information, Products & Services, Recent Developments)
- 6.4.1 AnHui JuCheng Fine Chemicals Co. Ltd
- 6.4.2 Anhui Tianrun Chemical Industry Co. Ltd
- 6.4.3 Ashland
- 6.4.4 BASF
- 6.4.5 Beijing Hengju Chemical Group Co. Ltd
- 6.4.6 Beijing Xitao Technology Development Co. Ltd
- 6.4.7 CHINAFLOC
- 6.4.8 Envitech Chemical Specialities Pvt. Ltd
- 6.4.9 Kemira
- 6.4.10 Liaocheng Yongxing Environmental Protection Science & Technology Co. Ltd
- 6.4.11 Qingdao Oubo Chemical Co. Ltd
- 6.4.12 Shandong Tongli Chemical Co. Ltd
- 6.4.13 SNF
- 6.4.14 Solenis
- 6.4.15 Syensqo
- 6.4.16 Universal Fine Chemicals SPC
- 6.4.17 Yixing Cleanwater Chemicals Co. Ltd
7 Market Opportunities & Future Outlook
- 7.1 White-Space & Unmet-Need Assessment

