PUBLISHER: Mordor Intelligence | PRODUCT CODE: 2122173

PUBLISHER: Mordor Intelligence | PRODUCT CODE: 2122173
United States Activated Carbon - Market Share Analysis, Industry Trends & Statistics, Growth Forecasts (2026 - 2031)
According to Mordor Intelligence, the United States activated carbon market size is expected to increase from 216.24 kilotons in 2025 to 223.64 kilotons in 2026 and reach 270.52 kilotons by 2031, growing at a CAGR of 3.88% over 2026-2031.
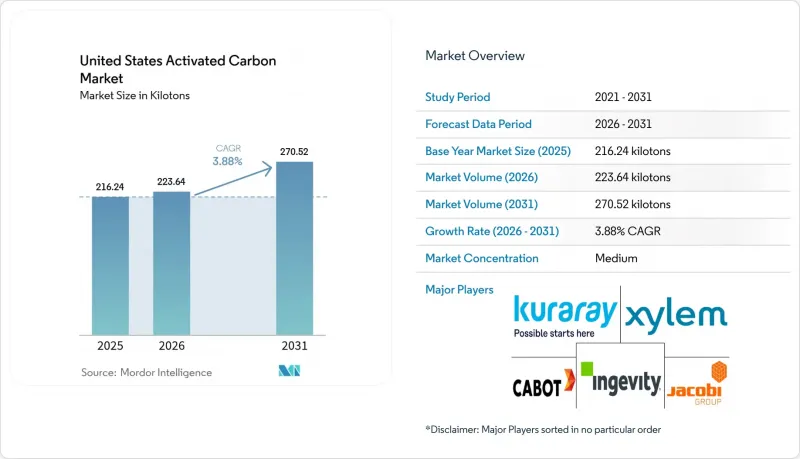
This report is Segmented by Product Type (Granular Activated Carbon, Powdered Activated Carbon, and Extruded or Pelletized Activated Carbon), Application (Water Purification, Gas Purification, Metal Extraction, Medicine, and Other Applications), End-User Industry (Water Treatment, Food and Beverage, Healthcare, Automotive, and More). The Market Forecasts are Provided in Terms of Volume (Tons).
United States Activated Carbon Market Trends and Insights
EPA Regulations on PFAS/PFOA in Drinking Water
The April 2024 National Primary Drinking Water Regulation sets a 4-parts-per-trillion maximum for PFOA and PFOS, forcing roughly 6,000-8,000 community systems to adopt granular activated carbon beds by 2029. Federal PFAS remediation funds and state revolving loans accelerate contract awards, rewarding vendors with NSF/ANSI 61 listings and domestic regeneration capacity. Smaller utilities collaborate through cooperative purchasing agreements to lower unit costs, and states including Michigan and New York provide matching grants that shorten payback periods. Ion-exchange resins appear in niche low-flow installations, but carbon's multi-contaminant profile and simpler residuals management preserve its dominance. Suppliers are now bundling media with IoT sensors that predict breakthrough, a service model that locks in multi-year aftermarket revenue.
Phase-Out of Mercury Emissions from Coal-Fired Utilities
The 2024 Mercury and Air Toxics Standards revision trims existing-unit limits to 0.003 lb/GWh, necessitating powdered activated carbon injection at 30 GW of lignite and sub-bituminous capacity by late 2027. Each 500-MW boiler adds 5,000-15,000 tons of annual demand, and brominated grades fetch price premiums for dual mercury-SO3 capture. Forward-curve volatility in coal retirement schedules prompts suppliers to favor two- to three-year indexed contracts rather than decade-long agreements. As retirements accelerate after 2030, vendors pivot toward gas-turbine carbon-capture projects that qualify for 45Q credits, partly offsetting the coal decline.
High Energy Cost of Virgin Steam Activation
Steam activation consumes 3-5 MWh per ton, and natural-gas price swings compress margins for plants without hedged supply. Reactivation, needing roughly 40% less energy, offers relief, yet potable-water users demand rigorous leachate testing before approving reused media. Section 45V hydrogen tax credits could enable electrolytic steam by 2028, but capital hurdles keep most producers on conventional fuel through the medium term. Vendors therefore index contracts to Henry Hub futures and experiment with biomass-derived syngas, a strategy that earns renewable-fuel credits but complicates process control.
Other drivers and restraints analyzed in the detailed report include:
- Tightening VOC Limits for Industrial Air Streams
- Rapid Expansion of Pharmaceutical API Capacity
- Competition from Silica Gel, Biochar, and Advanced Membranes
For complete list of drivers and restraints, kindly check the Table Of Contents.
Segment Analysis
Granular activate carbon commanded 46.37% of volume in 2025 as utilities and industrial users favored their backwash stability and ready access to regional reactivation kilns. Reactivation capacity underpins a circular procurement model that answers corporate sustainability goals and shields buyers from virgin-price volatility. At the same time, extruded or pelletized activated carbon is projected to grow 4.34% annually between 2026 and 2031, outpacing the broader United States activated carbon market. Automotive evaporative-emission canisters, mandated under Tier 3 regulations, increasingly specify larger-diameter pellets to mitigate butane breakthrough, while pharmaceutical continuous-manufacturing lines value the pellets' low friability.
Extruded innovation reshapes value propositions. Kuraray's 2024 4-mm pellet with 1,200 m2/g surface area offers 20% higher adsorption than legacy 3-mm formats. General Motors' USD 500 million hybrid-truck program keeps canister demand buoyant at least through 2028. Meanwhile, powdered carbon remains tactical, serving episodic taste-and-odor events in surface-water plants and mercury-injection duties at coal stations. Together, these dynamics reinforce the multi-speed nature of the United States activated carbon market size at the product-form level.
Complete Report Scope:
- By Product Type
- Granular Activated Carbon
- Powdered Activated Carbon
- Extruded or Pelletized Activated Carbon
- By Application
- Water Purification
- Gas Purification
- Metal Extraction
- Medicine
- Other Applications
- By End-user Industry
- Water Treatment
- Food and Beverage
- Healthcare
- Automotive
- Industrial Processing
- Other End-user Industries
List of Companies Covered in this Report:
- Advanced Emissions Solutions, Inc.
- Albemarle Corporation
- Arq, Inc.
- Boyce Carbon.
- Cabot Corporation
- Carbon Activated Corporation
- CarbUSA
- CPL Activated Carbons
- Donau Chemie AG
- General Carbon Corporation
- Ingevity
- JACOBI CARBONS GROUP
- KURARAY CO., LTD.
- Kureha Corporation
- Prominent Systems, Inc.
- Puragen Activated Carbons
- Veolia
- Xylem
Additional Benefits:
- The market estimate (ME) sheet in Excel format
- 3 months of analyst support
TABLE OF CONTENTS
1 Introduction
- 1.1 Study Assumptions and Market Definition
- 1.2 Scope of the Study
2 Research Methodology
3 Executive Summary
4 Market Landscape
- 4.1 Market Overview
- 4.2 Market Drivers
- 4.2.1 EPA Regulations on PFAS/PFOA in Drinking Water
- 4.2.2 Phase-Out of Mercury Emissions from Coal-Fired Utilities
- 4.2.3 Tightening VOC Limits for Industrial Air Streams
- 4.2.4 Rapid Expansion of Pharmaceutical API Capacity
- 4.2.5 Grid-Scale Super-capacitor Projects Using Activated Carbon
- 4.3 Market Restraints
- 4.3.1 High Energy Cost of Virgin Steam Activation
- 4.3.2 Competition from Silica Gel, Biochar and Advanced Membranes
- 4.3.3 Climate-Driven Supply Risk for Coconut-Shell Feedstocks
- 4.4 Value Chain Analysis
- 4.5 Porter's Five Forces
- 4.5.1 Bargaining Power of Suppliers
- 4.5.2 Bargaining Power of Consumers
- 4.5.3 Threat of New Entrants
- 4.5.4 Threat of Substitute Products and Services
- 4.5.5 Degree of Competition
5 Market Size and Growth Forecasts (Volume)
- 5.1 By Product Type
- 5.1.1 Granular Activated Carbon
- 5.1.2 Powdered Activated Carbon
- 5.1.3 Extruded or Pelletized Activated Carbon
- 5.2 By Application
- 5.2.1 Water Purification
- 5.2.2 Gas Purification
- 5.2.3 Metal Extraction
- 5.2.4 Medicine
- 5.2.5 Other Applications
- 5.3 By End-user Industry
- 5.3.1 Water Treatment
- 5.3.2 Food and Beverage
- 5.3.3 Healthcare
- 5.3.4 Automotive
- 5.3.5 Industrial Processing
- 5.3.6 Other End-user Industries
6 Competitive Landscape
- 6.1 Market Concentration
- 6.2 Strategic Moves
- 6.3 Market Share (%)/ Ranking Analysis
- 6.4 Company Profiles (includes Global level Overview, Market level overview, Core Segments, Financials as available, Strategic Information, Products and Services, and Recent Developments)
- 6.4.1 Advanced Emissions Solutions, Inc.
- 6.4.2 Albemarle Corporation
- 6.4.3 Arq, Inc.
- 6.4.4 Boyce Carbon.
- 6.4.5 Cabot Corporation
- 6.4.6 Carbon Activated Corporation
- 6.4.7 CarbUSA
- 6.4.8 CPL Activated Carbons
- 6.4.9 Donau Chemie AG
- 6.4.10 General Carbon Corporation
- 6.4.11 Ingevity
- 6.4.12 JACOBI CARBONS GROUP
- 6.4.13 KURARAY CO., LTD.
- 6.4.14 Kureha Corporation
- 6.4.15 Prominent Systems, Inc.
- 6.4.16 Puragen Activated Carbons
- 6.4.17 Veolia
- 6.4.18 Xylem
7 Market Opportunities and Future Outlook
- 7.1 White-space and Unmet-Need Assessment

