PUBLISHER: Mordor Intelligence | PRODUCT CODE: 2122235

PUBLISHER: Mordor Intelligence | PRODUCT CODE: 2122235
Hydrogen Peroxide - Market Share Analysis, Industry Trends & Statistics, Growth Forecasts (2026 - 2031)
According to Mordor Intelligence, the hydrogen peroxide market size is expected to increase from 6.11 Million tons in 2025 to 6.35 Million tons in 2026 and reach 7.71 Million tons by 2031, growing at a CAGR of 3.96% over 2026-2031.
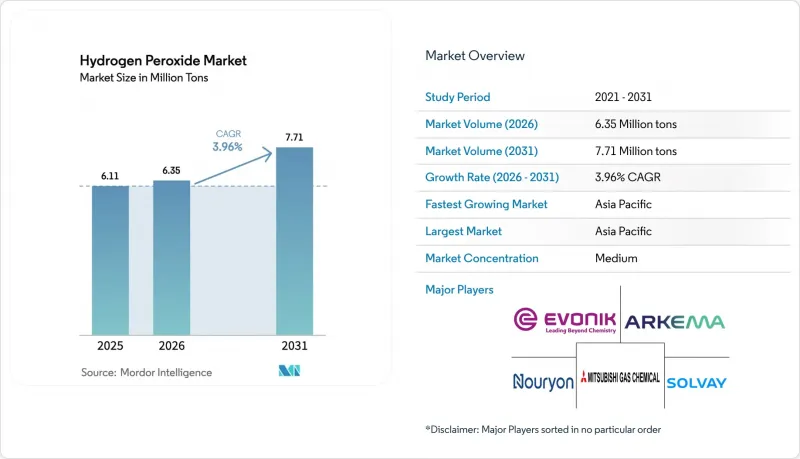
This report is Segmented by Product Function (Disinfectant, and More), Grade (Standard Grade, and More), Concentration/Form (Aqueous Solution and More), End-User Industry (Pulp and Paper, Chemical Synthesis, Wastewater, Mining, and More), and Geography (Asia-Pacific, North America, Europe, South America, and the Middle East and Africa). Market Forecasts are Provided in Terms of Volume (tons).
Global Hydrogen Peroxide Market Trends and Insights
Surging Ultra-High-Purity H2O2 Demand In Sub-5 nm Semiconductor Fabs
Leading chipmakers have tightened metal limits to below 10 parts-per-trillion for wafer cleaning, a ten-fold reduction from 7 nm nodes. Solvay doubled electronic-grade output at Zhenjiang in 2025 to meet this bar, while Mitsubishi Gas Chemical expanded in Japan to serve new lines in Arizona and Texas. Spot prices above USD 2.50 per kilogram, three times bleaching-grade levels, more than offset the niche's sub-3% volume share. Evonik's Leshan joint venture will come on stream in 2026, adding 30 kilotons of specialty capacity and securing the firm majority ownership for know-how control. Trade-tension risks linger because extreme-ultraviolet tool export restrictions could stall fabs outside Northeast Asia, concentrating demand geographically and raising supply-chain exposure. Suppliers that meet ISO 14644 Class 1 clean-room protocols enjoy switching-cost protection that discourages late entrants.
Sharp Rise In On-Site Electro-Oxidation For Decentralized Wastewater Treatment
Containerized units that make hydrogen peroxide from air and water at the treatment plant reduce transport risk and shorten supply chains. BASF put a 54 MW proton-exchange-membrane electrolyzer online in 2025 at Ludwigshafen, using green hydrogen for pilot advanced-oxidation reactors serving German industrial parks. In India, textile clusters adopted the technology after the pollution regulator set micropollutant limits in 2025. Delivered cost falls 20%-30% when haulage exceeds 500 km, yet the capital of about USD 1.5 million for a 100 m3 h-1 skid limits uptake to cities above 50,000 people. Electro-oxidation degrades pharmaceuticals, PFAS, and dye molecules that conventional biology cannot, giving operators a route to meet tighter discharge standards without major civil works.
EU Explosives-Precursor Tightening Lifts Distribution Costs For >35 wt% Grades
Regulation 2019/1148 requires end-user vetting, secure storage, and transaction reports for hydrogen peroxide above 35 wt%, lifting logistics cost by EUR 0.11-0.17 kg-1. Arkema spent EUR 3.2 million on compliance upgrades at its Jarrie site, an outlay that trimmed book value by 18% in 2024. Many small textile and cosmetics buyers have downshifted to 35 wt% grades to avoid paperwork, eroding high-margin drum sales. Customs checks now delay re-exports via Antwerp and Rotterdam, prompting a 12% drop in European shipments of >35 wt% peroxide to North Africa and the Gulf since 2024. Asian producers exempt from the rule have gained share in these destinations.
Other drivers and restraints analyzed in the detailed report include:
- Healthcare Infection-Control Mandates Boosting VHP Sterilization
- Low-Carbon H2O2 Routes Attracting ESG Premiums
- Anthraquinone Feedstock Volatility Tied To Coal-Tar Disruptions
For complete list of drivers and restraints, kindly check the Table Of Contents.
Segment Analysis
Bleaching still supplied 61.76% of 2025 volume, anchored in pulp mills that consume 8-12 kg per air-dried ton, yet growth trails as recycled fiber and enzyme pretreatments curb dosage. Disinfectant usage, by contrast, rises at a 4.44% CAGR because food processors, beverage fillers, and municipal water plants favor peroxide to avoid chlorinated by-products. Oxidants play a key role, particularly in HPPO propylene oxide synthesis, which aligns with polyurethane demand in insulation and automotive seating applications. Additionally, the use of oxidants in cleaning agents for semiconductor and pharmaceutical cleanrooms is influenced by purity requirements and pricing dynamics. The hydrogen peroxide market benefits from water-scarce regions opting for peroxide disinfection, which neither salts supply nor risks chlorate violation.
Disinfectant growth is most pronounced in South Asia and the Middle East, where desalinated water systems need a chlorine-free pathogen barrier. Bleaching remains robust in Southeast Asia, where 12 new recycled-fiber pulp mills started between 2024 and 2025. Textile mills pivot to enzymatic bleach bath setups that reduce peroxide input, trimming the hydrogen peroxide market share of fabric finishing. HPPO demand received a structural lift from LyondellBasell's 470 kiloton plant in Houston, locking in 188 kilotons of contract offtake. Electronics cleaning gains modest volume but high value, as a single 5 nm fab can generate peroxide revenue equivalent to many pulp lines.
Industrial Grade (35-50%) held a 42.27% share in 2025, serving pulp, textile, and wastewater. Chip fabs, pharma synthesis, and aerospace monopropellants support high-purity grades above 50 wt%'s growth. Standard grades below 35 wt% fill swimming-pool and household needs where metal tolerance is lenient, and the cost per kilogram is low. Solvay's Zhenjiang expansion added 25 kilotons of photovoltaic-grade product with phosphorus and boron below 0.1 ppb, underscoring the margin available when contamination specs align with solar-cell efficiency targets.
Evonik's Leshan project will add 30 kilotons of electronic-grade peroxide in 2026, confirming the hydrogen peroxide market size upside in the high-purity tier. Industrial-grade share erodes slowly as pulp mills install oxygen delignification, cutting usage per ton. Standard-grade growth is flat in mature economies but 6% in India and ASEAN, where household disinfection remains a growth habit post-pandemic. The cost barrier to enter the high-purity arena is steep: fluoropolymer-lined ISO containers and real-time ICP-MS monitoring add USD 0.10 kg-1 to logistics, while clean-room bottling lines cost USD 8-12 million each.
Complete Report Scope:
- By Product Function
- Disinfectant
- Bleaching
- Oxidant
- Other Product Function (Cleaning Agent, etc.)
- By Grade
- Standard Grade (less than 35% w/w)
- Industrial Grade (35-50%)
- High-Purity Grade (more than 50%)
- By Concentration / Form
- Aqueous Solution (less than or equal to 70%)
- Anhydrous (more than 90%)
- Powder/Granular Adducts (Perborate and Percarbonate)
- By End-user Industry
- Pulp and Paper
- Chemical Synthesis
- Wastewater Treatment
- Mining
- Food and Beverage
- Cosmetics and Healthcare
- Textiles
- Other End-user Industries (Electronics and Semiconductors, Transportation, Aseptic Packaging, and Rocketry)
- By Geography
- Asia-Pacific
- China
- India
- Japan
- South Korea
- Malaysia
- Thailand
- Indonesia
- Vietnam
- Rest of Asia-Pacific
- North America
- United States
- Canada
- Mexico
- Europe
- Germany
- United Kingdom
- France
- Italy
- Spain
- NORDIC Countries
- Turkey
- Russia
- Rest of Europe
- South America
- Brazil
- Argentina
- Colombia
- Rest of South America
- Middle East and Africa
- Saudi Arabia
- Qatar
- United Arab Emirates
- South Africa
- Egypt
- Nigeria
- Rest of Middle East and Africa
- Asia-Pacific
Geography Analysis
Asia-Pacific controlled 52.28% of the 2025 volume and is forecast to post a 4.33% CAGR to 2031. China remains a leading producer, but increasing anthracene costs and coal-tar restrictions have significantly raised production expenses since early 2025. India is witnessing steady growth, driven by rising demand for pharmaceutical intermediates, textile bleaching, and compliance with new municipal standards. Japan and South Korea are supporting high-purity demand through the establishment of new semiconductor fabrication facilities, with local chemical suppliers already meeting stringent metal limit certifications. Meanwhile, Indonesia, Vietnam, and Thailand have introduced recycled-fiber pulp lines in recent years, reinforcing regional demand for bleaching applications.
In North America, LyondellBasell's Houston HPPO unit and Dow's Freeport plant together commit 250-280 kilotons of captive offtake, stabilizing merchant pricing. Ultra-pure supply chains now link Solvay's Deer Park site with Arizona fabs by dedicated ISO tanks. Europe is shifting to low-carbon grades; BASF's 54 MW electrolyzer at Ludwigshafen feeds renewable hydrogen into peroxide loops. EU Regulation 2019/1148 lifts logistics cost for >35 wt% strengths, prompting some customers to downgrade concentration or import from Asia.
South America sees annual growth, tied to Brazil's eucalyptus-pulp expansions and Argentina's mining projects that test cyanide-free peroxide leaching. The Middle East and Africa post growth albeit from a small base under 180 kilotons. Saudi wastewater upgrades and South African gold mines drive incremental demand. Overall, the hydrogen peroxide market sees Asia dominating volume, while Europe and North America host margin-rich niches in electronics and low-carbon supply.
- Arkema
- BASF
- Chang Chun Group
- Dow
- Engro Corporation Limited.
- Evonik Industries AG
- FMC Corporation
- Guangdong Zhongcheng Chemicals Inc.
- Gujarat Alkalies & Chemicals Limited
- Hodogaya Chemical Co. Ltd.
- Indian Peroxide Ltd.
- Kemira
- Kingboard Chemical Holdings Ltd.
- Luxi Chemical Group
- Mitsubishi Gas Chemical Company Inc.
- National Peroxide Ltd.
- Nippon Paper Chemicals Co. Ltd.
- Nouryon
- OCI Peroxygens LLC
- PQ Corporation
- Qingdao LaSheng Co. Ltd.
- Sichuan Hebang Biotechnology Co. Ltd.
- Solvay
- Thai Peroxide Company Ltd.
Additional Benefits:
- The market estimate (ME) sheet in Excel format
- 3 months of analyst support
TABLE OF CONTENTS
1 Introduction
- 1.1 Study Assumptions & Market Definition
- 1.2 Scope of the Study
2 Research Methodology
3 Executive Summary
4 Market Landscape
- 4.1 Market Overview
- 4.2 Market Drivers
- 4.2.1 Surging ultra-high-purity H2O2 demand in sub-5 nm semiconductor fabs
- 4.2.2 Sharp rise in onsite electro-oxidation systems for decentralised wastewater treatment
- 4.2.3 Capacity expansion of recycled-fibre pulp mills in SE-Asia
- 4.2.4 Growth of HPPO (hydrogen-peroxide-to-propylene-oxide) plants in Europe and China
- 4.2.5 Healthcare infection-control mandates boosting VHP sterilisation equipment sales
- 4.2.6 Low-carbon H2O2 routes (renewable H2 and PEM electrolysis) gaining ESG premiums
- 4.3 Market Restraints
- 4.3.1 EU "explosives-precursor" tightening lifts distribution costs for more than 35% grades
- 4.3.2 Anthraquinone feedstock volatility linked to coal-tar supply disruptions
- 4.3.3 High-purity logistics (ppb metal limits) require costly single-use canisters
- 4.3.4 Process safety upgrades (LOPA/SIL) raising CAPEX for new more than and equal to 70% plants
- 4.4 Value Chain Analysis
- 4.5 Porter's Five Forces
- 4.5.1 Bargaining Power of Suppliers
- 4.5.2 Bargaining Power of Buyers
- 4.5.3 Threat of New Entrants
- 4.5.4 Threat of Substitutes
- 4.5.5 Degree of Competition
- 4.6 Pricing Analysis
- 4.7 Trade Scenario
- 4.8 Supply Scenario
5 Market Size & Growth Forecasts (Volume)
- 5.1 By Product Function
- 5.1.1 Disinfectant
- 5.1.2 Bleaching
- 5.1.3 Oxidant
- 5.1.4 Other Product Function (Cleaning Agent, etc.)
- 5.2 By Grade
- 5.2.1 Standard Grade (less than 35% w/w)
- 5.2.2 Industrial Grade (35-50%)
- 5.2.3 High-Purity Grade (more than 50%)
- 5.3 By Concentration / Form
- 5.3.1 Aqueous Solution (less than or equal to 70%)
- 5.3.2 Anhydrous (more than 90%)
- 5.3.3 Powder/Granular Adducts (Perborate and Percarbonate)
- 5.4 By End-user Industry
- 5.4.1 Pulp and Paper
- 5.4.2 Chemical Synthesis
- 5.4.3 Wastewater Treatment
- 5.4.4 Mining
- 5.4.5 Food and Beverage
- 5.4.6 Cosmetics and Healthcare
- 5.4.7 Textiles
- 5.4.8 Other End-user Industries (Electronics and Semiconductors, Transportation, Aseptic Packaging, and Rocketry)
- 5.5 By Geography
- 5.5.1 Asia-Pacific
- 5.5.1.1 China
- 5.5.1.2 India
- 5.5.1.3 Japan
- 5.5.1.4 South Korea
- 5.5.1.5 Malaysia
- 5.5.1.6 Thailand
- 5.5.1.7 Indonesia
- 5.5.1.8 Vietnam
- 5.5.1.9 Rest of Asia-Pacific
- 5.5.2 North America
- 5.5.2.1 United States
- 5.5.2.2 Canada
- 5.5.2.3 Mexico
- 5.5.3 Europe
- 5.5.3.1 Germany
- 5.5.3.2 United Kingdom
- 5.5.3.3 France
- 5.5.3.4 Italy
- 5.5.3.5 Spain
- 5.5.3.6 NORDIC Countries
- 5.5.3.7 Turkey
- 5.5.3.8 Russia
- 5.5.3.9 Rest of Europe
- 5.5.4 South America
- 5.5.4.1 Brazil
- 5.5.4.2 Argentina
- 5.5.4.3 Colombia
- 5.5.4.4 Rest of South America
- 5.5.5 Middle East and Africa
- 5.5.5.1 Saudi Arabia
- 5.5.5.2 Qatar
- 5.5.5.3 United Arab Emirates
- 5.5.5.4 South Africa
- 5.5.5.5 Egypt
- 5.5.5.6 Nigeria
- 5.5.5.7 Rest of Middle East and Africa
- 5.5.1 Asia-Pacific
6 Competitive Landscape
- 6.1 Market Concentration
- 6.2 Strategic Moves
- 6.3 Market Share(%)/Ranking Analysis
- 6.4 Company Profiles {(includes Global level Overview, Market level overview, Core Segments, Financials as available, Strategic Information, Products & Services, Recent Developments)}
- 6.4.1 Arkema
- 6.4.2 BASF
- 6.4.3 Chang Chun Group
- 6.4.4 Dow
- 6.4.5 Engro Corporation Limited.
- 6.4.6 Evonik Industries AG
- 6.4.7 FMC Corporation
- 6.4.8 Guangdong Zhongcheng Chemicals Inc.
- 6.4.9 Gujarat Alkalies & Chemicals Limited
- 6.4.10 Hodogaya Chemical Co. Ltd.
- 6.4.11 Indian Peroxide Ltd.
- 6.4.12 Kemira
- 6.4.13 Kingboard Chemical Holdings Ltd.
- 6.4.14 Luxi Chemical Group
- 6.4.15 Mitsubishi Gas Chemical Company Inc.
- 6.4.16 National Peroxide Ltd.
- 6.4.17 Nippon Paper Chemicals Co. Ltd.
- 6.4.18 Nouryon
- 6.4.19 OCI Peroxygens LLC
- 6.4.20 PQ Corporation
- 6.4.21 Qingdao LaSheng Co. Ltd.
- 6.4.22 Sichuan Hebang Biotechnology Co. Ltd.
- 6.4.23 Solvay
- 6.4.24 Thai Peroxide Company Ltd.
7 Market Opportunities & Future Outlook
- 7.1 White-space and Unmet-Need Assessment
- 7.2 Emerging Opportunities in Advanced Oxidation and Semiconductor Cleaning

