PUBLISHER: Mordor Intelligence | PRODUCT CODE: 2122451

PUBLISHER: Mordor Intelligence | PRODUCT CODE: 2122451
Precious Metal Catalysts - Market Share Analysis, Industry Trends & Statistics, Growth Forecasts (2026 - 2031)
According to Mordor Intelligence, the precious metal catalysts market size was valued at 445.60 tons in 2025 and is estimated to grow from 449.12 tons in 2026 to reach 467.14 tons by 2031, at a CAGR of 0.79% during the forecast period (2026-2031).
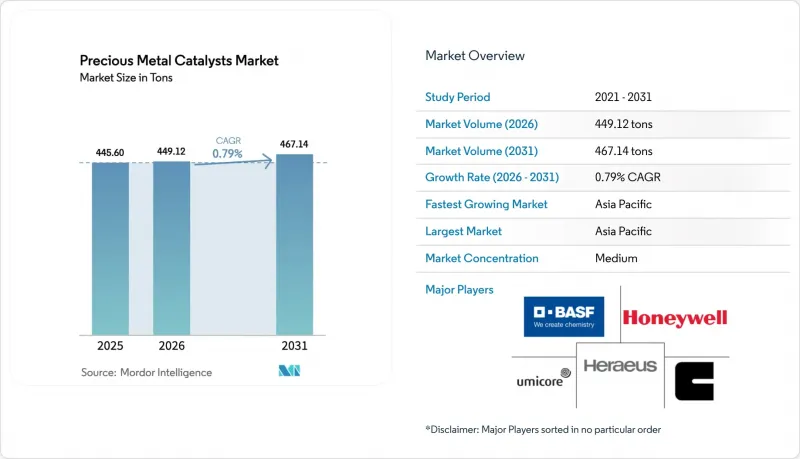
This report is Segmented by Metal Type (Platinum, Palladium, and More), Catalyst Form (Powder, Pellet/Bead, and More), Manufacturing Process (Incipient Wetness Impregnation, Electroless and Electrochemical Deposition, and More), Application (Automotive, Pharmaceutical, and More), and Geography (Asia-Pacific, North America, Europe, and More). Market Forecasts are Provided in Terms of Volume (Tons).
Global Precious Metal Catalysts Market Trends and Insights
Stricter Tail-Pipe and Stationary-Emission Standards
The European Commission finalized Euro 7 in late 2025 for 2027 implementation, forcing OEMs to raise rhodium and palladium loadings by 15-20% per vehicle. China's National VI-b, effective July 2024, triggered a 12% increase in PGM catalyst demand among domestic automakers in 2025. India's Bharat Stage VII (April 2028) will extend real-driving-emission caps to two-wheelers, creating a fresh addressable segment. U.S. EPA Tier 4 Final standards are simultaneously boosting platinum-based oxidation catalysts for non-road diesel engines. The net result is a value-accretive mix enrichment that partially offsets stagnant ICE volumes.
Petro-Refinery Shift to Higher-Octane Clean Fuels
International Maritime Organization sulfur caps and regional low-sulfur gasoline mandates are driving refinery upgrades that favor platinum-on-alumina catalysts for hydroprocessing. Saudi Aramco's Jazan refinery, commissioned in 2024, deployed more than 200 tons of precious-metal catalysts across its hydrocracking trains. Reliance Industries earmarked USD 1.2 billion in 2025 for BS-VII compliance at Jamnagar, anchoring incremental demand for platinum-rhenium catalysts. These investments underpin a parallel growth avenue that balances BEV-driven autocatalyst attrition.
Persistent PGM Price Volatility and Supply Shocks
Rhodium vacillated between USD 9,200 and USD 14,000/oz in 2025 after South African mine outages cut supply by 18%. Russian palladium exports fell 40 tons under sanctions, forcing European formulators to buy higher-priced recycled metal. Iridium jumped 35% on electrolyzer orders, deferring several PEM projects. Tier 2 suppliers without integrated recycling absorbed a 400-600 bp margin compression under fixed-price contracts.
Other drivers and restraints analyzed in the detailed report include:
- Platinum Substitution for Palladium in Tri-Metal Autocatalysts
- Green-Hydrogen Build-Out Spurring Ir/Pt Catalyst Demand
- EV Penetration Shrinking ICE Autocatalyst Demand
For complete list of drivers and restraints, kindly check the Table Of Contents.
Segment Analysis
Platinum retained a 40.92% share in 2025, anchored by its versatility across autocatalyst, refinery, and pharmaceutical platforms. Iridium, though small in absolute terms, is expanding at a 3.01% CAGR on the back of PEM electrolyzer deployment. Ruthenium is carving a niche in chlor-alkali and ammonia catalysts for process-economic gains. AI-optimized nanoparticles are halving iridium intensity in 1-MW electrolyzers, reinforcing a value-over-volume trajectory.
Atomic-layer deposition is crucial here: Johnson Matthey demonstrated 50% higher oxygen-evolution rates with iridium dots on titanium oxide, cutting metal intensity per MW in half. For platinum, narrowing discounts to palladium are opening price headroom that sustains formulation experimentation.
Powder catalysts accounted for 52.98% of 2025 demand, dominating pharmaceutical batch reactors and refinery fixed beds thanks to easy regeneration. Wash-coated monoliths are growing at a 1.66% CAGR, as automotive and stationary emission systems prize low pressure drop. Umicore's 2025 rhodium-free monolith meets Euro VI limits with 30% less total PGM. Pellet forms target hydrogenation reactors where mechanical strength offsets costs. Integration efficiencies place monoliths at the forefront of emission-control research and development, while powders retain primacy where batch flexibility prevails.
Complete Report Scope:
- By Metal Type
- Platinum
- Palladium
- Rhodium
- Iridium
- Ruthenium
- Other Metal Types (Osmium, Gold, Silver)
- By Catalyst Form
- Powder
- Pellet / Bead
- Extrudate and Honeycomb
- Wash-coated Monolith
- By Manufacturing Process
- Incipient Wetness Impregnation
- Electroless and Electrochemical Deposition
- Chemical Vapour / Atomic Layer Deposition
- Sol-Gel / Precipitation
- Other Advanced Nano-structuring
- By Application
- Automotive
- Pharmaceutical
- Petrochemicals
- Other Applications (Electronics and Semiconductor, Fuel Cells, etc.)
- By Geography
- Asia-Pacific
- China
- Japan
- India
- South Korea
- ASEAN Countries
- Rest of Asia-Pacific
- North America
- United States
- Canada
- Mexico
- Europe
- Germany
- United Kingdom
- France
- Italy
- Rest of Europe
- South America
- Brazil
- Argentina
- Rest of South America
- Middle East and Africa
- Saudi Arabia
- South Africa
- Rest of Middle-East and Africa
- Asia-Pacific
Geography Analysis
Asia-Pacific controlled 39.82% of the 2025 volume and is set to grow at a 1.22% CAGR despite China's NEV policy headwinds. China's National VI-b raised PGM loadings per ICE by 14% in 2025, cushioning catalyst volume decline. Japan's JPY 300 billion electrolyzer subsidy is pivoting the supply chain toward iridium recycling, with TANAKA tripling PEM catalyst capacity. India's Bharat Stage VII will boost two-wheeler catalyst penetration from below 40% today, adding significant upside. South Korea's 12,000 NEXO deliveries in 2025 kept platinum cathode volumes buoyant.
North America remains value-dense: U.S. refiners installed 8 tons of platinum catalysts to meet Tier 3 sulfur requirements in 2025. Europe's EUR 3 billion electrolyzer funding is funneling iridium demand into Germany, Spain, and the Netherlands. South America leans on Brazil's ethanol blend mandate, driving platinum-rhenium reforming catalyst purchases. The Middle East benefits from new hydrocracking trains at Jazan, while South Africa leverages domestic PGM mining for competitive recycling logistics.
- ALS
- American Elements
- BASF
- Catalytic Products International
- CHIMET
- Clariant
- Evonik Industries AG
- Heraeus Precious Metals
- Honeywell International, Inc.
- Kaili Catalyst New Materials Co., Ltd.
- ReMetall Deutschland AG
- Sabin Metal Corp.
- Shaanxi Kaida Chemical Co., Ltd.
- Stanford Advanced Materials
- Takasago International Corporation
- TANAKA Precious Metal Group Co., Ltd.
- Thermo Fisher Scientific Inc.
- Umicore
- Valterra Platinum Limited
Additional Benefits:
- The market estimate (ME) sheet in Excel format
- 3 months of analyst support
TABLE OF CONTENTS
1 Introduction
- 1.1 Study Assumptions and Market Definition
- 1.2 Scope of the Study
2 Research Methodology
3 Executive Summary
4 Market Landscape
- 4.1 Market Overview
- 4.2 Market Drivers
- 4.2.1 Stricter tail-pipe and stationary-emission standards
- 4.2.2 Petro-refinery shift to higher-octane clean fuels
- 4.2.3 Platinum substitution for palladium in tri-metal autocatalysts
- 4.2.4 Green-hydrogen build-out spurring Ir/Pt catalyst demand
- 4.2.5 AI-designed reaction pathways trimming PGM loadings
- 4.3 Market Restraints
- 4.3.1 Persistent PGM price volatility and supply shocks
- 4.3.2 EV penetration shrinking ICE autocatalyst demand
- 4.3.3 Rising recycling rates denting primary demand
- 4.4 Value Chain Analysis
- 4.5 Porter's Five Forces
- 4.5.1 Threat of New Entrants
- 4.5.2 Bargaining Power of Suppliers
- 4.5.3 Bargaining Power of Buyers
- 4.5.4 Threat of Substitutes
- 4.5.5 Competitive Rivalry
5 Market Size and Growth Forecasts (Volume)
- 5.1 By Metal Type
- 5.1.1 Platinum
- 5.1.2 Palladium
- 5.1.3 Rhodium
- 5.1.4 Iridium
- 5.1.5 Ruthenium
- 5.1.6 Other Metal Types (Osmium, Gold, Silver)
- 5.2 By Catalyst Form
- 5.2.1 Powder
- 5.2.2 Pellet / Bead
- 5.2.3 Extrudate and Honeycomb
- 5.2.4 Wash-coated Monolith
- 5.3 By Manufacturing Process
- 5.3.1 Incipient Wetness Impregnation
- 5.3.2 Electroless and Electrochemical Deposition
- 5.3.3 Chemical Vapour / Atomic Layer Deposition
- 5.3.4 Sol-Gel / Precipitation
- 5.3.5 Other Advanced Nano-structuring
- 5.4 By Application
- 5.4.1 Automotive
- 5.4.2 Pharmaceutical
- 5.4.3 Petrochemicals
- 5.4.4 Other Applications (Electronics and Semiconductor, Fuel Cells, etc.)
- 5.5 By Geography
- 5.5.1 Asia-Pacific
- 5.5.1.1 China
- 5.5.1.2 Japan
- 5.5.1.3 India
- 5.5.1.4 South Korea
- 5.5.1.5 ASEAN Countries
- 5.5.1.6 Rest of Asia-Pacific
- 5.5.2 North America
- 5.5.2.1 United States
- 5.5.2.2 Canada
- 5.5.2.3 Mexico
- 5.5.3 Europe
- 5.5.3.1 Germany
- 5.5.3.2 United Kingdom
- 5.5.3.3 France
- 5.5.3.4 Italy
- 5.5.3.5 Rest of Europe
- 5.5.4 South America
- 5.5.4.1 Brazil
- 5.5.4.2 Argentina
- 5.5.4.3 Rest of South America
- 5.5.5 Middle East and Africa
- 5.5.5.1 Saudi Arabia
- 5.5.5.2 South Africa
- 5.5.5.3 Rest of Middle-East and Africa
- 5.5.1 Asia-Pacific
6 Competitive Landscape
- 6.1 Market Concentration
- 6.2 Strategic Moves
- 6.3 Market Share (%)/Ranking Analysis
- 6.4 Company Profiles (includes Global level Overview, Market level overview, Core Segments, Financials as available, Strategic Information, Products and Services, and Recent Developments)
- 6.4.1 ALS
- 6.4.2 American Elements
- 6.4.3 BASF
- 6.4.4 Catalytic Products International
- 6.4.5 CHIMET
- 6.4.6 Clariant
- 6.4.7 Evonik Industries AG
- 6.4.8 Heraeus Precious Metals
- 6.4.9 Honeywell International, Inc.
- 6.4.10 Kaili Catalyst New Materials Co., Ltd.
- 6.4.11 ReMetall Deutschland AG
- 6.4.12 Sabin Metal Corp.
- 6.4.13 Shaanxi Kaida Chemical Co., Ltd.
- 6.4.14 Stanford Advanced Materials
- 6.4.15 Takasago International Corporation
- 6.4.16 TANAKA Precious Metal Group Co., Ltd.
- 6.4.17 Thermo Fisher Scientific Inc.
- 6.4.18 Umicore
- 6.4.19 Valterra Platinum Limited
7 Market Opportunities and Future Outlook
- 7.1 White-space and Unmet-need Assessment

