PUBLISHER: Mordor Intelligence | PRODUCT CODE: 2123281

PUBLISHER: Mordor Intelligence | PRODUCT CODE: 2123281
5G Services - Market Share Analysis, Industry Trends & Statistics, Growth Forecasts (2026 - 2031)
According to Mordor Intelligence, the 5G services market size is expected to increase from USD 130.46 billion in 2025 to USD 133.73 billion in 2026 and reach USD 320.48 billion by 2031, growing at a CAGR of 19.1% over 2026-2031.
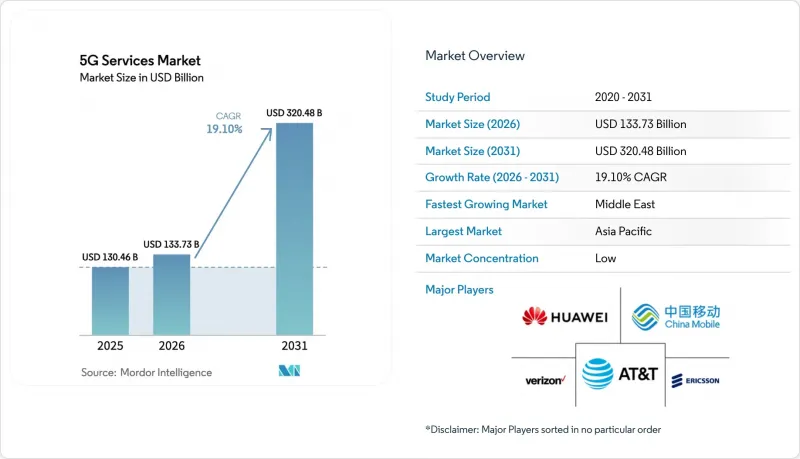
This report is Segmented by Service Type (Enhanced Mobile Broadband, Ultra-Reliable Low-Latency Comms, and More), Network Architecture (Non-Standalone 5G and Standalone 5G), Frequency Band (Low-Band, Mid-Band, and Millimetre-Wave), End-User Industry (IT and Telecom, Media and Entertainment, Automotive and Mobility, and More), and Geography. The Market Forecasts are Provided in Terms of Value (USD).
Global 5G Services Market Trends and Insights
Exploding Mobile Data Traffic
Monthly traffic rose from 141 exabytes in 2025 to an estimated 400 exabytes by 2031, straining suburban macro layers and triggering extra mid-band cell splits. Fixed-wireless lines doubled year-on-year in North America, diverting capacity from mobility channels and validating the economics of millimeter-wave small cells. Ultra-HD video now represents 72% of downlink volumes, while cloud gaming introduces bursty uplink peaks that require dynamic spectrum sharing. Always-connected wearables and automotive telematics diversify session profiles, pushing carriers toward AI-driven traffic steering that sustains quality of experience during congestion events.
High Consumer Demand for eMBB Services
Unlimited gigabit plans account for 52.84% of total 5G revenue, and U.S. operators report average revenue per user uplifts of USD 4.20 from plan migration. South Korean carriers bundled cloud storage and streaming perks, boosting premium-tier adoption to more than 38% within 6 months. Smartphone-based 8K capture creates symmetrical traffic bursts, forcing investment in uplink carrier aggregation and supplemental spectrum blocks. Operators monetize handset upgrades through zero-interest financing that shortens replacement cycles and locks subscribers into higher-margin tiers.
High Deployment Cost and Long ROI Horizons
Standalone cores, dense mid-band grids, and upgraded backhaul exceed USD 150 billion in global outlays over 2024-2027, stretching payback to 7-9 years. A U.S. carrier revealed USD 18 billion incremental capex for C-band densification, while rural sites without fiber need USD 250,000 each, widening digital divides. Energy bills rise 30-40% versus 4G, pushing operators to sign renewable power agreements to satisfy carbon pledges and control opex. Capital pressure delays stand-alone migration in cost-sensitive regions.
Other drivers and restraints analyzed in the detailed report include:
- Enterprise Digital-Transformation Use Cases
- Government Spectrum-Release Initiatives
- Fragmented and Delayed Spectrum Policy
For complete list of drivers and restraints, kindly check the Table Of Contents.
Segment Analysis
Enhanced Mobile Broadband accounted for 52.84% of 2025 revenue, reflecting demand for gigabit-rate consumer packages and suburban fixed-wireless links. Massive Machine-Type Communications, however, is expanding at 19.21% through 2031, signaling a pivot toward battery-efficient sensors that flood manufacturing, utilities, and smart-city grids. The 5G services market size for narrowband IoT endpoints is rising as operators refarm guard bands and legacy 2G spectrum for low-power overlays, enabling support for 50,000 devices per cell at module prices below 5 USD.
URLLC remains niche, limited to vehicle-to-everything pilots and remote control robotics awaiting mature liability frameworks. Still, by 2028, Release 18 scheduling and edge-compute convergence will blur the lines between service types. Operators bundling mMTC slices with analytics platforms generate sticky enterprise revenue, bolstering long-term growth of the 5G services market.
Non-Standalone deployments held 63.72% share in 2025 because LTE cores enabled quick time-to-market. Yet Standalone networks, growing at 19.53%, are a prerequisite for slicing, deterministic latency, and voice-over-new-radio services. A U.S. carrier trimmed call set-up times 35% after national SA activation. The 5G services market share shift accelerates as enterprise clients demand dedicated SLAs that NSA cannot guarantee.
Capex hurdles remain, but operators retiring legacy packet cores realize opex savings from data-center consolidation and cloud-native automation. Emerging markets may retain NSA longer, yet greenfield entrants without LTE baggage leapfrog straight to cloud-native SA, expanding the 5G services market footprint in underserved geographies.
Complete Report Scope:
- By Service Type
- Enhanced Mobile Broadband (eMBB)
- Ultra-Reliable Low-Latency Comms (URLLC)
- Massive Machine-Type Comms (mMTC)
- By Network Architecture
- Non-Standalone (NSA) 5G
- Standalone (SA) 5G
- By Frequency Band
- Low-Band (Less than 1 GHz)
- Mid-Band (1- 6 GHz)
- Millimetre-Wave (Greater than 24 GHz)
- By End-User Industry
- IT and Telecom
- Media and Entertainment
- Automotive and Mobility
- Energy and Utilities
- Aerospace and Defense
- Manufacturing
- Healthcare
- Other End-User Industries
- By Geography
- North America
- United States
- Canada
- Mexico
- South America
- Brazil
- Argentina
- Rest of South America
- Europe
- Germany
- United Kingdom
- France
- Italy
- Russia
- Rest of Europe
- Asia Pacific
- China
- India
- Japan
- South Korea
- Rest of Asia Pacific
- Middle East
- Saudi Arabia
- United Arab Emirates
- Turkey
- Rest of Middle East
- Africa
- South Africa
- Nigeria
- Rest of Africa
- North America
Geography Analysis
Asia Pacific supplied 40.92% of 2025 revenue, anchored by China's four-million-site mid-band footprint and India's rapid urban coverage by two national carriers. China Mobile launched 5G-Advanced in 300 cities late in 2025, bundling 10 Gbps premium tiers and gaming passes. Japan's Open RAN buildouts cut rural site costs 28%, while South Korea boasts 72% 5G penetration, the world's highest.
The Middle East is the fastest-growing territory at a 20.01% CAGR. United Arab Emirates operators achieved 95% population reach by mid-2025, underpinning smart-city pilots with autonomous shuttles and AI traffic controls. Saudi carriers launched standalone cores across major metros to serve oil, logistics, and healthcare verticals in line with Vision 2030 ambitions, while Turkey switched on 5G in its three largest cities, targeting fixed-wireless competition
North America and Europe exhibit slower subscriber-driven growth but pivot to enterprise and fixed-wireless scaling. A U.S. carrier's C-band network covered 230 million people by December 2025, monetizing 4 million fixed-wireless lines. Deutsche Telekom's cross-border slices boosted enterprise revenue 14% year-on-year. South America and Africa trail because of auction delays, device affordability gaps, and backhaul shortfalls, although selective rollouts in Brazil and South Africa defend mobile incumbents against fiber overtures.
- China Mobile Ltd.
- Verizon Communications Inc.
- AT&T Inc.
- T-Mobile US Inc.
- China Telecom Corp. Ltd.
- Telefonaktiebolaget LM Ericsson
- Nokia Corp.
- Huawei Technologies Co. Ltd.
- Deutsche Telekom AG
- Vodafone Group Plc
- Orange S.A.
- Telefonica S.A.
- BT Group plc
- Swisscom AG
- Telstra Corp. Ltd.
- SK Telecom Co. Ltd.
- KT Corp.
- Rakuten Mobile Inc.
- Reliance Jio Infocomm Ltd.
- Qualcomm Inc.
- Samsung Electronics Co. Ltd.
- ZTE Corp.
- NTT Docomo Inc.
- Bharti Airtel Ltd.
Additional Benefits:
- The market estimate (ME) sheet in Excel format
- 3 months of analyst support
TABLE OF CONTENTS
1 INTRODUCTION
- 1.1 Study Assumptions and Market Definition
- 1.2 Scope of the Study
2 RESEARCH METHODOLOGY
3 EXECUTIVE SUMMARY
4 MARKET LANDSCAPE
- 4.1 Market Overview
- 4.2 Market Drivers
- 4.2.1 Exploding Mobile Data Traffic
- 4.2.2 High Consumer Demand For eMBB Services
- 4.2.3 Enterprise Digital-Transformation Use-Cases
- 4.2.4 Government Spectrum-Release Initiatives
- 4.2.5 Private-5G Uptake in CBRS and Local-Licence Bands
- 4.2.6 Monetisation Via Network Slicing and SLA Tiers
- 4.3 Market Restraints
- 4.3.1 High Deployment Cost and Long ROI Horizons
- 4.3.2 Fragmented and Delayed Spectrum Policy
- 4.3.3 Limited 5G Device Readiness In Emerging Markets
- 4.3.4 Geopolitical Vendor Restrictions and Trade Bans
- 4.4 Value Chain Analysis
- 4.5 Regulatory Landscape
- 4.6 Technological Outlook
- 4.7 Porter's Five Forces
- 4.7.1 Threat of New Entrants
- 4.7.2 Bargaining Power of Buyers
- 4.7.3 Bargaining Power of Suppliers
- 4.7.4 Threat of Substitutes
- 4.7.5 Intensity of Competitive Rivalry
5 MARKET SIZE AND GROWTH FORECASTS (VALUE)
- 5.1 By Service Type
- 5.1.1 Enhanced Mobile Broadband (eMBB)
- 5.1.2 Ultra-Reliable Low-Latency Comms (URLLC)
- 5.1.3 Massive Machine-Type Comms (mMTC)
- 5.2 By Network Architecture
- 5.2.1 Non-Standalone (NSA) 5G
- 5.2.2 Standalone (SA) 5G
- 5.3 By Frequency Band
- 5.3.1 Low-Band (Less than 1 GHz)
- 5.3.2 Mid-Band (1- 6 GHz)
- 5.3.3 Millimetre-Wave (Greater than 24 GHz)
- 5.4 By End-User Industry
- 5.4.1 IT and Telecom
- 5.4.2 Media and Entertainment
- 5.4.3 Automotive and Mobility
- 5.4.4 Energy and Utilities
- 5.4.5 Aerospace and Defense
- 5.4.6 Manufacturing
- 5.4.7 Healthcare
- 5.4.8 Other End-User Industries
- 5.5 By Geography
- 5.5.1 North America
- 5.5.1.1 United States
- 5.5.1.2 Canada
- 5.5.1.3 Mexico
- 5.5.2 South America
- 5.5.2.1 Brazil
- 5.5.2.2 Argentina
- 5.5.2.3 Rest of South America
- 5.5.3 Europe
- 5.5.3.1 Germany
- 5.5.3.2 United Kingdom
- 5.5.3.3 France
- 5.5.3.4 Italy
- 5.5.3.5 Russia
- 5.5.3.6 Rest of Europe
- 5.5.4 Asia Pacific
- 5.5.4.1 China
- 5.5.4.2 India
- 5.5.4.3 Japan
- 5.5.4.4 South Korea
- 5.5.4.5 Rest of Asia Pacific
- 5.5.5 Middle East
- 5.5.5.1 Saudi Arabia
- 5.5.5.2 United Arab Emirates
- 5.5.5.3 Turkey
- 5.5.5.4 Rest of Middle East
- 5.5.6 Africa
- 5.5.6.1 South Africa
- 5.5.6.2 Nigeria
- 5.5.6.3 Rest of Africa
- 5.5.1 North America
6 COMPETITIVE LANDSCAPE
- 6.1 Market Concentration
- 6.2 Strategic Moves
- 6.3 Market Share Analysis
- 6.4 Company Profiles {(includes Global level Overview, Market level overview, Core Segments, Financials as available, Strategic Information, Market Rank/Share for key companies, Products and Services, and Recent Developments)}
- 6.4.1 China Mobile Ltd.
- 6.4.2 Verizon Communications Inc.
- 6.4.3 AT&T Inc.
- 6.4.4 T-Mobile US Inc.
- 6.4.5 China Telecom Corp. Ltd.
- 6.4.6 Telefonaktiebolaget LM Ericsson
- 6.4.7 Nokia Corp.
- 6.4.8 Huawei Technologies Co. Ltd.
- 6.4.9 Deutsche Telekom AG
- 6.4.10 Vodafone Group Plc
- 6.4.11 Orange S.A.
- 6.4.12 Telefonica S.A.
- 6.4.13 BT Group plc
- 6.4.14 Swisscom AG
- 6.4.15 Telstra Corp. Ltd.
- 6.4.16 SK Telecom Co. Ltd.
- 6.4.17 KT Corp.
- 6.4.18 Rakuten Mobile Inc.
- 6.4.19 Reliance Jio Infocomm Ltd.
- 6.4.20 Qualcomm Inc.
- 6.4.21 Samsung Electronics Co. Ltd.
- 6.4.22 ZTE Corp.
- 6.4.23 NTT Docomo Inc.
- 6.4.24 Bharti Airtel Ltd.
7 MARKET OPPORTUNITIES AND FUTURE OUTLOOK
- 7.1 White-space and Unmet-need Assessment

