PUBLISHER: Mordor Intelligence | PRODUCT CODE: 2123794

PUBLISHER: Mordor Intelligence | PRODUCT CODE: 2123794
Aquaponics - Market Share Analysis, Industry Trends & Statistics, Growth Forecasts (2026 - 2031)
According to Mordor Intelligence, the aquaponics market size was valued at USD 1.06 billion in 2025 and estimated to grow from USD 1.20 billion in 2026 to reach USD 2.20 billion by 2031, at a CAGR of 12.89% during the forecast period (2026-2031).
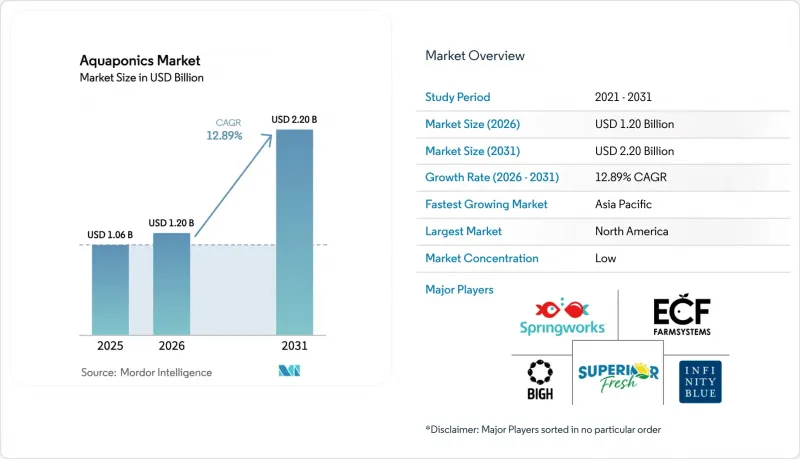
This report is Segmented by Crop Type (Leafy Greens, Herbs and Microgreens, Tomatoes, Cucumbers, Berries, and More), by Fish Species (Tilapia, Catfish, Trout, and More), by Production Scale (Large-Scale and Small and Medium-Scale), and by Geography (North America, South America, Europe, Asia-Pacific, Middle East, and Africa). The Market Forecasts are Provided in Terms of Value (USD).
Global Aquaponics Market Trends and Insights
Rising Demand for Locally Sourced Pesticide-Free Produce
Urban shoppers are increasingly demanding traceable vegetables harvested within 24 hours, and aquaponics eliminates the need for synthetic pesticides because fish cannot tolerate chemical residues in recirculating water. Superior Fresh LLC shuttered its hydroponic lettuce production in Indiana in 2024 to concentrate capital on its integrated Wisconsin complex, signaling that dual protein-and-produce models generate superior margins. Retail premiums of 20.0-30.0% encourage operators to bypass wholesale channels through farmers' markets and subscription deliveries, stabilizing cash cycles during peak demand seasons.
Adoption of Circular-Economy Water-Conservation Practices
Aquaponics recycles approximately 90.0% of the system's water, aligning perfectly with European Union circular economy directives and drought mitigation strategies in the Middle East. Singapore's Agri-Food and Veterinary Authority has earmarked SGD 309 million (USD 229.3 million) to support low-water agrifood research through 2025. The LIFE-LEMNERGY project in the European Union, currently running in the 2021-2027 phase, has achieved nitrogen removal above 85.0% by integrating duckweed nutrient recovery, cutting discharge, and generating biogas that offsets climate-control energy costs.
High Upfront Capital and Operational Complexity
Commercial installations cost USD 500-1,000 per square meter, exceeding hydroponic equivalents by up to 50.0%, because integrated systems must harmonize fish tanks, biofilters, and climate management systems. Energy accounts for as much as 40.0% of operating budgets in temperate zones, and power outages can cause catastrophic fish mortality if backup generators fail. Payback often stretches beyond five years, a horizon that traditional agricultural lenders and venture capital find unattractive.
Other drivers and restraints analyzed in the detailed report include:
- Integration with Vertical Farming for Urban Food Security
- Commercialization of High-Value Medicinal Herbs
- Zoonotic Pathogen Management Risks
For complete list of drivers and restraints, kindly check the Table Of Contents.
Segment Analysis
Leafy greens captured 46.3% of revenue in 2025, while herbs and microgreens are advancing at a 13.7% CAGR through 2031. Herbs mature in three to six weeks, versus eight to ten weeks for head lettuce, enabling faster cash rotation. Wholesale prices for basil, mint, and cilantro are two to three times higher than those for lettuce, reflecting the higher energy costs associated with climate-controlled environments. Tomatoes, cucumbers, and berries remain niche because they require precise calcium-to-magnesium balancing and pollination services, which increase labor inputs. Medicinal botanicals, including ginseng and kratom, require licensing and third-party potency assays, yet their margins can exceed 60.0% when supply contracts with pharmaceutical buyers are secured.
Additional expansion into strawberries, peppers, and Asian specialty vegetables is unfolding in the Asia-Pacific region, where rising disposable income underpins the willingness to pay for novelty and safety certifications. The International Organization for Standardization 22000 framework is increasingly stipulated in export contracts to Europe and Japan. Operators with diversified crop portfolios hedge against market volatility, but they must manage species-specific nutrient uptakes to avert deficiencies that can ripple through the integrated system.
Complete Report Scope:
- By Crop Type
- Leafy Greens
- Herbs and Microgreens
- Tomatoes
- Cucumbers
- Berries
- Other Crops
- By Fish Species
- Tilapia
- Catfish
- Trout
- Other Fish
- By Production Scale
- Large-Scale
- Small and Medium-Scale
- By Geography
- North America
- United States
- Canada
- Rest of North America
- South America
- Brazil
- Argentina
- Rest of South America
- Europe
- Germany
- Netherlands
- France
- United Kingdom
- Italy
- Rest of Europe
- Asia-Pacific
- China
- Japan
- India
- Australia
- South Korea
- Rest of Asia-Pacific
- Middle East
- United Arab Emirates
- Saudi Arabia
- Rest of Middle East
- Africa
- South Africa
- Kenya
- Rest of Africa
- North America
Geography Analysis
North America led the aquaponics market in 2025, with a 34.2% revenue share, as consumers paid premiums for pesticide-free produce and state grants offset capital expenses for controlled-environment facilities. Activity concentrates in Wisconsin, California, and the Mid-Atlantic, where urban density keeps the distribution radius short. Canada's Agricultural Clean Technology Program subsidizes retrofits in British Columbia and Ontario, regions that are particularly affected by high heating costs during the winter. Regulatory clarity is an advantage because the United States Department of Agriculture (USDA) allows organic labeling for aquaponic outputs, simplifying marketing and price positioning.
The Asia-Pacific region is the fastest-growing zone, with a 13.1% CAGR projected to 2031, as megacities face land scarcity and increasing food security mandates. China repurposes idle warehouses for integrated fish and plant hubs, while Japan funds community resilience pilots in rural prefectures. India's clusters in Bangalore and Mumbai respond to food-safety concerns among middle-class consumers, and Australia promotes barramundi to differentiate from tilapia-heavy imports. South Korea is exploring rooftop systems in Seoul and Busan, although its urban agriculture policy is still in formation.
Europe's investment trajectory aligns with the circular economy directives. Belgium's BIGH rooftop farm proves that harvest-to-shelf times under two hours can be profitable. The United Kingdom's Flo-Gro shrimp configuration widens species options, but inconsistent organic certification and elevated energy tariffs challenge Southern European operators. The Middle East and Africa utilize aquaponics to conserve scarce freshwater resources. The United Arab Emirates and Saudi Arabia blend desalination with solar power to reduce operating costs. South Africa pilots off-grid aquaponics in Cape Town and Johannesburg, while Brazil and Argentina nurture early-stage deployments in Sao Paulo and Buenos Aires, tempered by limited project finance and regulatory uncertainty.
- Superior Fresh LLC
- ECF Farmsystems GmbH
- Infinity Blue Barramundi LLC (MainStream Aquaculture Group)
- Traders Hill Farm
- Great Lakes Aquaponics
- Springworks Farm Maine, Inc.
- Bella Vita Farm LLC
- Waterfield Farms Inc.
- AquaSprout Farms, LLC
- Waterwheel Farms
- Victory Farms Ltd.
- Blue Acre Appalachian Aquaponics Center
- WaterFarmers Urban Agriculture (Sustainnovation Inc.)
- BIGH
- Deepwater Farms
Additional Benefits:
- The market estimate (ME) sheet in Excel format
- 3 months of analyst support
TABLE OF CONTENTS
1 Introduction
- 1.1 Study Assumptions and Market Definition
- 1.2 Scope of the Study
2 Research Methodology
3 Executive Summary
4 Market Landscape
- 4.1 Market Overview
- 4.2 Market Drivers
- 4.2.1 Rising demand for locally sourced pesticide-free produce
- 4.2.2 Adoption of circular-economy water conservation practices
- 4.2.3 Integration with vertical farming for urban food security
- 4.2.4 Commercialization of high-value medicinal herbs
- 4.2.5 Government incentives for sustainable agriculture
- 4.2.6 Advances in controlled-environment monitoring
- 4.3 Market Restraints
- 4.3.1 High upfront capital and operational complexity
- 4.3.2 Zoonotic pathogen management risks
- 4.3.3 Limited availability of skilled labor
- 4.3.4 Fragmented regulatory standards across markets
- 4.4 Regulatory Landscape
- 4.5 Technological Outlook
- 4.6 Porter's Five Forces Analysis
- 4.6.1 Threat of New Entrants
- 4.6.2 Bargaining Power of Suppliers
- 4.6.3 Bargaining Power of Buyers
- 4.6.4 Threat of Substitutes
- 4.6.5 Intensity of Competitive Rivalry
5 Market Size and Growth Forecasts (Value)
- 5.1 By Crop Type
- 5.1.1 Leafy Greens
- 5.1.2 Herbs and Microgreens
- 5.1.3 Tomatoes
- 5.1.4 Cucumbers
- 5.1.5 Berries
- 5.1.6 Other Crops
- 5.2 By Fish Species
- 5.2.1 Tilapia
- 5.2.2 Catfish
- 5.2.3 Trout
- 5.2.4 Other Fish
- 5.3 By Production Scale
- 5.3.1 Large-Scale
- 5.3.2 Small and Medium-Scale
- 5.4 By Geography
- 5.4.1 North America
- 5.4.1.1 United States
- 5.4.1.2 Canada
- 5.4.1.3 Rest of North America
- 5.4.2 South America
- 5.4.2.1 Brazil
- 5.4.2.2 Argentina
- 5.4.2.3 Rest of South America
- 5.4.3 Europe
- 5.4.3.1 Germany
- 5.4.3.2 Netherlands
- 5.4.3.3 France
- 5.4.3.4 United Kingdom
- 5.4.3.5 Italy
- 5.4.3.6 Rest of Europe
- 5.4.4 Asia-Pacific
- 5.4.4.1 China
- 5.4.4.2 Japan
- 5.4.4.3 India
- 5.4.4.4 Australia
- 5.4.4.5 South Korea
- 5.4.4.6 Rest of Asia-Pacific
- 5.4.5 Middle East
- 5.4.5.1 United Arab Emirates
- 5.4.5.2 Saudi Arabia
- 5.4.5.3 Rest of Middle East
- 5.4.6 Africa
- 5.4.6.1 South Africa
- 5.4.6.2 Kenya
- 5.4.6.3 Rest of Africa
- 5.4.1 North America
6 Competitive Landscape
- 6.1 Market Concentration
- 6.2 Strategic Moves
- 6.3 Market Share Analysis
- 6.4 Company Profiles (includes Global-Level Overview, Market-Level Overview, Core Segments, Financials as Available, Strategic Information, Market Rank/Share for Key Companies, Products and Services, and Recent Developments)
- 6.4.1 Superior Fresh LLC
- 6.4.2 ECF Farmsystems GmbH
- 6.4.3 Infinity Blue Barramundi LLC (MainStream Aquaculture Group)
- 6.4.4 Traders Hill Farm
- 6.4.5 Great Lakes Aquaponics
- 6.4.6 Springworks Farm Maine, Inc.
- 6.4.7 Bella Vita Farm LLC
- 6.4.8 Waterfield Farms Inc.
- 6.4.9 AquaSprout Farms, LLC
- 6.4.10 Waterwheel Farms
- 6.4.11 Victory Farms Ltd.
- 6.4.12 Blue Acre Appalachian Aquaponics Center
- 6.4.13 WaterFarmers Urban Agriculture (Sustainnovation Inc.)
- 6.4.14 BIGH
- 6.4.15 Deepwater Farms
7 Market Opportunities and Future Outlook

