PUBLISHER: Mordor Intelligence | PRODUCT CODE: 2124129

PUBLISHER: Mordor Intelligence | PRODUCT CODE: 2124129
Europe Wind Power - Market Share Analysis, Industry Trends & Statistics, Growth Forecasts (2026 - 2031)
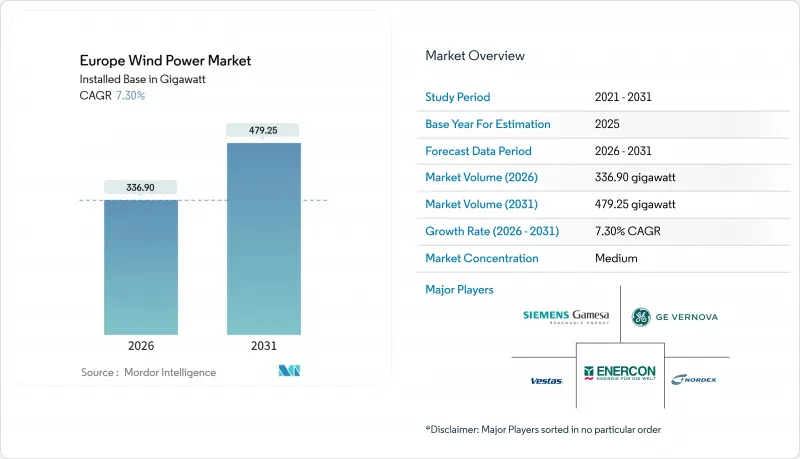
According to Mordor Intelligence, the Europe wind power market size in terms of installed base is expected to grow from 336.90 gigawatt in 2026 to 479.25 gigawatt by 2031, at a CAGR of 7.30% during the forecast period (2026-2031).
This report is Segmented by Location (Onshore and Offshore), Turbine Capacity (Up To 3 MW, 3 To 6 MW, and Above 6 MW), Application (Utility-Scale, Commercial and Industrial, and Community Projects), and Geography (Germany, United Kingdom, France, Spain, Italy, Poland, Sweden, Denmark, and Rest of Europe). The Market Sizes and Forecasts are Provided in Terms of Installed Capacity (GW).
Europe Wind Power Market Trends and Insights
EU Green Deal & Fit-for-55 Targets
The legislative package obliges member states to update national energy and climate plans every two years and lifts the 2030 renewable-electricity target to 45%, implying a 500 GW wind fleet, 63% above 2025 capacity. Carbon border adjustment on steel and cement from 2026 is steering tower and foundation production back into the continent. Germany earmarked EUR 4.6 billion in 2025 for grid reinforcement to integrate 145 GW of wind by 2030. Denmark's Energy Island will hub 10 GW of offshore wind and export surplus power, illustrating how transnational coordination multiplies national build-outs. Policy momentum, therefore, keeps the European wind power market on a high-growth trajectory despite supply-chain headwinds.
Rapid LCOE Decline of On- & Offshore Turbines
Onshore levelized costs slid to EUR 0.043-0.092 /kWh in 2024, while offshore costs fell to EUR 0.055-0.103 /kWh as 15 MW platforms trimmed balance-of-system expenses. The UK's 2024 CfD round cleared offshore bids 30% below the strike price, proving merchant risk tolerable in robust demand centers. Poland's onshore auction undercut coal generation for the first time, prompting accelerated plant retirements. Vestas' V162-6.2 MW turbine delivered a 48% capacity factor in inland Germany during 2025, underscoring how larger rotors boost yields on legacy sites. Declining generation costs underpin competitive pricing for corporate PPAs and confirm the cost advantage driving the European wind power market.
Grid Congestion & Weak Interconnection Build-Out
Germany curtailed 8.2 TWh of wind in 2023 at a taxpayer cost of EUR 3.1 billion as SuedLink and SuedOstLink slipped to 2028 completion. Spain faced 2.5 TWh in 2023 curtailments, and the UK's grid queue hit 283 GW with seven-year wait times. While the 1.4 GW NeuConnect link eased some constraints, only 2% of the transfer capacity needed to smooth continental imbalances is live. RWE's 500 MW battery at Kaskasi shows storage can claw back six percentage points of effective capacity, but large-scale transmission remains the critical bottleneck limiting near-term gains for the European wind power market.
Other drivers and restraints analyzed in the detailed report include:
- Surging Corporate PPA Demand
- Repowering of >15-Year Onshore Fleets
- Lengthy Permitting & Local Opposition
For complete list of drivers and restraints, kindly check the Table Of Contents.
Segment Analysis
Offshore wind is expanding at a 17.2% CAGR, double the European wind power market average, as floating platforms unlock water depths beyond 60 m. Onshore assets still represented 85.5% of the European wind power market size in 2025, grounded in Germany's 60 GW fleet and Spain's 30 GW base. ScotWind's 10.5 GW awards and Poland's 8 GW Baltic pipeline will lift offshore's share to 22% by 2031. Offshore projects carry 45-55% capacity factors and 15-year CfDs, de-risking revenues, whereas onshore greenfield builds battle land-use constraints. Repowering 20-year turbines with 6 MW machines triples output on fixed interconnections, preserving onshore relevance and ensuring a balanced expansion across the European wind power market.
Second-generation floating standards (IEC 61400-3-2) harmonize requirements, slicing certification costs by 15%. Offshore lead times of five to seven years remain longer than onshore, but capacity factors compensate, attracting capital. Onshore growth now clusters in Poland and Sweden, while Denmark and the Netherlands pivot toward sea-based projects. This evolving mix underpins a resilient deployment outlook for the Europe wind power market.
Complete Report Scope:
- By Location
- Onshore
- Offshore
- By Turbine Capacity
- Up to 3 MW
- 3 to 6 MW
- Above 6 MW
- By Application
- Utility-scale
- Commercial and Industrial
- Community Projects
- By Component (Qualitative Analysis)
- Nacelle/Turbine
- Blade
- Tower
- Generator and Gearbox
- Balance-of-System
- By Geography
- Germany
- United Kingdom
- France
- Spain
- Italy
- Poland
- Sweden
- Denmark
- Rest of Europe
List of Companies Covered in this Report:
- Acciona Energia
- Orsted
- EDF Renewables
- E.ON
- Iberdrola Renovables
- RWE Renewables
- Vattenfall
- Statkraft
- EnBW
- General Electric
- Siemens Gamesa
- Vestas
- Nordex
- Enercon
- Goldwind Europe
- MingYang Europe
- LM Wind Power
- Prysmian Group
- Nexans
Additional Benefits:
- The market estimate (ME) sheet in Excel format
- 3 months of analyst support
TABLE OF CONTENTS
1 Introduction
- 1.1 Study Assumptions & Market Definition
- 1.2 Scope of the Study
2 Research Methodology
3 Executive Summary
4 Market Landscape
- 4.1 Market Overview
- 4.2 Market Drivers
- 4.2.1 EU Green Deal & Fit-for-55 targets
- 4.2.2 Rapid LCOE decline of on- & offshore turbines
- 4.2.3 Surging corporate PPA demand
- 4.2.4 Repowering of >15-year onshore fleets
- 4.2.5 Commercialisation of floating offshore wind
- 4.2.6 Next-gen recyclable blade technology
- 4.3 Market Restraints
- 4.3.1 Grid congestion & weak interconnection build-out
- 4.3.2 Lengthy permitting & local opposition
- 4.3.3 Biodiversity litigation risk (birds, marine mammals)
- 4.3.4 Rare-earth magnet supply-chain exposure
- 4.4 Supply-Chain Analysis
- 4.5 Regulatory Landscape
- 4.6 Technological Outlook
- 4.7 Porter's Five Forces
- 4.7.1 Bargaining Power of Suppliers
- 4.7.2 Bargaining Power of Buyers
- 4.7.3 Threat of New Entrants
- 4.7.4 Threat of Substitutes
- 4.7.5 Competitive Rivalry
5 Market Size & Growth Forecasts
- 5.1 By Location
- 5.1.1 Onshore
- 5.1.2 Offshore
- 5.2 By Turbine Capacity
- 5.2.1 Up to 3 MW
- 5.2.2 3 to 6 MW
- 5.2.3 Above 6 MW
- 5.3 By Application
- 5.3.1 Utility-scale
- 5.3.2 Commercial and Industrial
- 5.3.3 Community Projects
- 5.4 By Component (Qualitative Analysis)
- 5.4.1 Nacelle/Turbine
- 5.4.2 Blade
- 5.4.3 Tower
- 5.4.4 Generator and Gearbox
- 5.4.5 Balance-of-System
- 5.5 By Geography
- 5.5.1 Germany
- 5.5.2 United Kingdom
- 5.5.3 France
- 5.5.4 Spain
- 5.5.5 Italy
- 5.5.6 Poland
- 5.5.7 Sweden
- 5.5.8 Denmark
- 5.5.9 Rest of Europe
6 Competitive Landscape
- 6.1 Market Concentration
- 6.2 Strategic Moves (M&A, Partnerships, PPAs)
- 6.3 Market Share Analysis (Market Rank/Share for key companies)
- 6.4 Company Profiles (includes Global level Overview, Market level overview, Core Segments, Financials as available, Strategic Information, Products & Services, and Recent Developments)
- 6.4.1 Acciona Energia
- 6.4.2 Orsted
- 6.4.3 EDF Renewables
- 6.4.4 E.ON
- 6.4.5 Iberdrola Renovables
- 6.4.6 RWE Renewables
- 6.4.7 Vattenfall
- 6.4.8 Statkraft
- 6.4.9 EnBW
- 6.4.10 General Electric
- 6.4.11 Siemens Gamesa
- 6.4.12 Vestas
- 6.4.13 Nordex
- 6.4.14 Enercon
- 6.4.15 Goldwind Europe
- 6.4.16 MingYang Europe
- 6.4.17 LM Wind Power
- 6.4.18 Prysmian Group
- 6.4.19 Nexans
7 Market Opportunities & Future Outlook
- 7.1 White-space & Unmet-need Assessment

