PUBLISHER: Mordor Intelligence | PRODUCT CODE: 2124278

PUBLISHER: Mordor Intelligence | PRODUCT CODE: 2124278
Food Cans - Market Share Analysis, Industry Trends & Statistics, Growth Forecasts (2026 - 2031)
According to Mordor Intelligence, the food cans market size stands at USD 28.47 billion in 2026 and is forecast to reach USD 35.86 billion by 2031, progressing at a 4.72% CAGR.
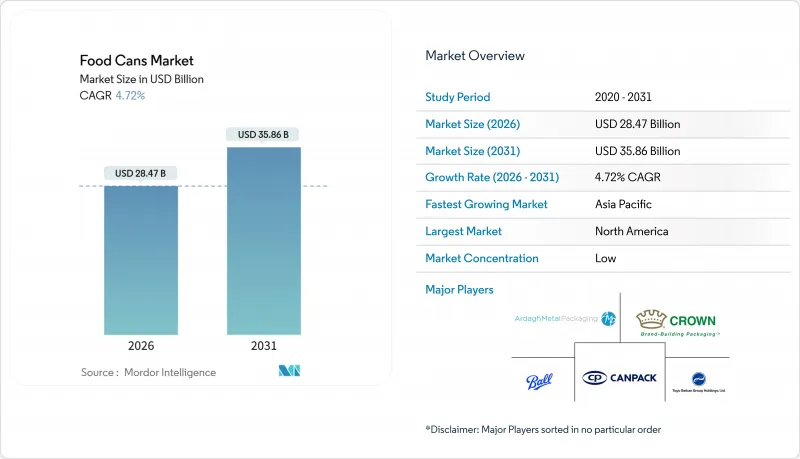
This report is Segmented by Material Type (Steel/Tin, and Aluminum), Can Type (2-Piece Cans, and 3-Piece Cans), Can Size (Small, Medium, and Large), Application (Ready Meals, Fish and Seafood, Fruits and Vegetables, Processed Food, Pet Food, and More), and Geography (North America, South America, Europe, Asia-Pacific, and Middle East and Africa). The Market Forecasts are Provided in Terms of Value (USD).
Global Food Cans Market Trends and Insights
Rising Disposable Incomes and Urbanization Boosting Packaged Food Consumption
Rapid migration to cities across India, Indonesia, and Brazil is shrinking the window for home cooking, so households are stocking shelf-stable proteins, fruits, and vegetables that require no refrigeration. India's Reliance Consumer Products has committed INR 40,000 crore (USD 4.8 billion) to integrated food parks, with the inaugural plant in Kurnool focusing on canned produce. This signals that processors view metal packaging as a first wave before cold-chain infrastructure matures.Brazil's retail turnover reached USD 183 billion in 2024, with consumers trading down into value-priced canned staples rather than exiting categories, a pattern replicated in secondary cities across South America.
Expansion of Modern Retail and E-commerce Grocery Channels
Direct-to-consumer grocery models rely on packaging that can withstand last-mile bumps without refrigeration, giving metal cans a structural advantage over glass. Mexico's modern retail sector captured more than 50% of household food expenditures in 2024, with e-commerce sales reaching USD 542 million, thereby widening shelf space for private-label canned beans and chilies.The United Arab Emirates banned several single-use plastic items in 2026, prompting quick-service restaurants to adopt ambient-stable canned soups for delivery platforms.
Shift Toward Flexible Plastic Pouches and Cartons Due to Cost and Weight Advantages
Flexible pouches weigh up to 40% less than equivalent cans, so brand owners chasing lower transport emissions adopt them for fruit cups and gravy toppers. Toyo Seikan reported share gains for its retort-pouch line in 2024 as private labels sought cheaper single-serve options. Carton suppliers such as SIG use thin aluminum laminate to approximate metal-can barrier properties, challenging ambient soup SKUs across Europe.
Other drivers and restraints analyzed in the detailed report include:
- Superior Barrier Properties and Shelf Life Extension Compared to Flexible Packaging
- Increasing Pet Ownership Driving Demand for Wet Pet Food in Metal Cans
- Volatility in Aluminum and Steel Prices Affecting Profit Margins
For complete list of drivers and restraints, kindly check the Table Of Contents.
Segment Analysis
Steel and tin-based cans generated 63.06% of food cans market revenue in 2025, yet aluminum posted the fastest 5.43% CAGR through 2031. The food cans market size for aluminum formats is widening because lightweight alloys allow 10%-15% thinner walls that reduce freight cost without compromising burst strength. Novelis delivered 63% recycled content across its rolled-product mix in 2024, validating closed-loop economics that reduce carbon intensity by more than 90% relative to primary production. Aluminum's malleability enables seamless two-piece designs that attract premium pet food and ready-meal brands, while steel stays dominant in price-led categories where deep-draw tooling amortizes over high volumes.
Converters favor aluminum when shipping to e-commerce warehouses that bill by dimensional weight, and the material's non-ferrous nature avoids corrosion in acidic tomato bases. Still, magnetic steel simplifies municipal sortation, an edge in mature North American recycling systems. In emerging markets, limited remelt capacity caps aluminum uptake, so steel maintains hold in staple canned vegetables. The dual-material landscape means processors often dual-source to hedge price swings, further advancing the food cans market as players align substrate to channel and geography.
Three-piece welded cans captured 58.63% of revenue in 2025, but two-piece drawn-and-ironed designs are expanding at a 5.32% CAGR through 2031. Krones filling lines now process more than 120,000 units per hour, allowing converters to amortize higher tooling costs faster and achieve a sub-USD 0.30 cost for a standard 400-gram can. Seamless bodies eliminate side welds, reducing coating needs and enhancing shelf appeal, which boosts adoption in premium pet food and microwavable ready meals.
The food cans market share for two-piece formats climbs fastest in the Asia-Pacific region, where greenfield plants often skip legacy welding altogether. Ball Corporation will invest USD 60 million in Andhra Pradesh to add two-piece capacity, in line with India's double-digit growth in metal packaging demand. Three-piece technology remains favored for institutional cans weighing above 500 grams because deep draws would require more costly tooling. As processors balance cost, speed, and material intensity, both formats coexist, giving the food cans market resilient substrate diversity.
Complete Report Scope:
- By Material Type
- Steel/Tin
- Aluminum
- By Can Type
- 2-piece Cans
- 3-piece Cans
- By Can Size
- Small (Less than Equal to 200 g)
- Medium (201-500 g)
- Large (More than 500 g)
- By Application
- Ready Meals
- Fish and Seafood
- Fruits and Vegetables
- Processed Food
- Pet Food
- Other Applications
- By Geography
- North America
- United States
- Canada
- Mexico
- South America
- Brazil
- Argentina
- Rest of South America
- Europe
- Germany
- United Kingdom
- France
- Italy
- Spain
- Rest of Europe
- Asia-Pacific
- China
- Japan
- India
- South Korea
- Australia
- Rest of Asia-Pacific
- Middle East and Africa
- Middle East
- Saudi Arabia
- United Arab Emirates
- Turkey
- Rest of Middle East
- Africa
- South Africa
- Egypt
- Nigeria
- Rest of Africa
- Middle East
- North America
Geography Analysis
North America held 39.87% of the global revenue in 2025, as entrenched canning lines, established supply chains, and high per-capita consumption sustain baseline volumes. Growth lags behind the global CAGR as the population plateaus, yet operational upgrades support margins. Crown Holdings sold its European tinplate arm to reallocate capital toward North American specialty food cans, underscoring a shift to higher-margin niches. Steel price volatility and a 43% aluminum-can recycling rate in 2023 have tightened scrap supply, nudging converters to pass through surcharges.
The Asia-Pacific region expands at the fastest rate, with a 6.42% CAGR, driven by urbanization, increased disposable income, and investment in local supply chains. Ball's Sri City and Taloja expansions demonstrate how global majors are localizing two-piece lines to cater to multinational food processors entering India. China's tinplate mills and Southeast Asian tuna corridors attract joint ventures blending Japanese coating know-how with local distribution. India's World Food India summit drew INR 1.02 trillion (USD 12.2 billion) in pledges, pivoting toward canned produce to circumvent limited cold chains.
Europe advances at roughly 4.3% CAGR, a pace dampened by slow demographic growth but energized by sustainability rules. The December 2024 BPA ban forces converters to adopt next-generation linings, amplifying capital needs yet giving early movers a marketing edge. Private-label penetration continues to rise as discounters promote value-oriented canned assortments. South America and the Middle East and Africa grow at mid-single digits; Brazil's USD 183 billion retail market shows resilience and the UAE plastic-ban shift adds incremental can volumes in foodservice settings.
- Crown Holdings Inc.
- Silgan Holdings Inc.
- Trivium Packaging
- Toyo Seikan Group Holdings Ltd.
- CANPACK S.A.
- Sonoco Products Company
- Ardagh Metal Packaging
- Ball Corporation (Food Can Division)
- Wells Can Company
- Kian Joo Group
- Visy Industries
- Jamestrong Packaging
- Colep Packaging
- Aaron Packaging Inc.
- CPMC Holdings Ltd.
- Greif Inc.
- Daeryuk Can Co. Ltd.
- Huber Packaging Group
- Crown Asia Pacific Holdings
- HPM Packaging
Additional Benefits:
- The market estimate (ME) sheet in Excel format
- 3 months of analyst support
TABLE OF CONTENTS
1 INTRODUCTION
- 1.1 Study Assumptions and Market Definition
- 1.2 Scope of the Study
2 RESEARCH METHODOLOGY
3 EXECUTIVE SUMMARY
4 MARKET LANDSCAPE
- 4.1 Market Overview
- 4.2 Market Drivers
- 4.2.1 Rising Disposable Incomes and Urbanization Boosting Packaged Food Consumption
- 4.2.2 Expansion of Modern Retail and E-commerce Grocery Channels
- 4.2.3 Superior Barrier Properties and Shelf Life Extension Compared to Flexible Packaging
- 4.2.4 Increasing Pet Ownership Driving Demand for Wet Pet Food in Metal Cans
- 4.2.5 Increased Adoption of High-speed Two-piece Can Manufacturing Lines in Emerging Markets
- 4.2.6 Growing Use of Smart Can QR Codes Enabling Traceability and Consumer Engagement
- 4.3 Market Restraints
- 4.3.1 Shift Toward Flexible Plastic Pouches and Cartons Due to Cost and Weight Advantages
- 4.3.2 Volatility in Aluminum and Steel Prices Affecting Profit Margins
- 4.3.3 Stringent Regulations Against BPA-based Epoxy Linings
- 4.3.4 Limited Recycling Infrastructure for Multi-layer Polymer Coated Steel Cans in Developing Economies
- 4.4 Industry Value Chain Analysis
- 4.5 Impact of Macroeconomic Factors on the Market
- 4.6 Regulatory Landscape
- 4.7 Technological Outlook
- 4.8 Porter's Five Forces Analysis
- 4.8.1 Bargaining Power of Suppliers
- 4.8.2 Bargaining Power of Buyers
- 4.8.3 Threat of New Entrants
- 4.8.4 Threat of Substitute Products
- 4.8.5 Intensity of Competitive Rivalry
- 4.9 Investment Analysis
5 MARKET SIZE AND GROWTH FORECASTS (VALUE)
- 5.1 By Material Type
- 5.1.1 Steel/Tin
- 5.1.2 Aluminum
- 5.2 By Can Type
- 5.2.1 2-piece Cans
- 5.2.2 3-piece Cans
- 5.3 By Can Size
- 5.3.1 Small (Less than Equal to 200 g)
- 5.3.2 Medium (201-500 g)
- 5.3.3 Large (More than 500 g)
- 5.4 By Application
- 5.4.1 Ready Meals
- 5.4.2 Fish and Seafood
- 5.4.3 Fruits and Vegetables
- 5.4.4 Processed Food
- 5.4.5 Pet Food
- 5.4.6 Other Applications
- 5.5 By Geography
- 5.5.1 North America
- 5.5.1.1 United States
- 5.5.1.2 Canada
- 5.5.1.3 Mexico
- 5.5.2 South America
- 5.5.2.1 Brazil
- 5.5.2.2 Argentina
- 5.5.2.3 Rest of South America
- 5.5.3 Europe
- 5.5.3.1 Germany
- 5.5.3.2 United Kingdom
- 5.5.3.3 France
- 5.5.3.4 Italy
- 5.5.3.5 Spain
- 5.5.3.6 Rest of Europe
- 5.5.4 Asia-Pacific
- 5.5.4.1 China
- 5.5.4.2 Japan
- 5.5.4.3 India
- 5.5.4.4 South Korea
- 5.5.4.5 Australia
- 5.5.4.6 Rest of Asia-Pacific
- 5.5.5 Middle East and Africa
- 5.5.5.1 Middle East
- 5.5.5.1.1 Saudi Arabia
- 5.5.5.1.2 United Arab Emirates
- 5.5.5.1.3 Turkey
- 5.5.5.1.4 Rest of Middle East
- 5.5.5.2 Africa
- 5.5.5.2.1 South Africa
- 5.5.5.2.2 Egypt
- 5.5.5.2.3 Nigeria
- 5.5.5.2.4 Rest of Africa
- 5.5.5.1 Middle East
- 5.5.1 North America
6 COMPETITIVE LANDSCAPE
- 6.1 Market Concentration
- 6.2 Strategic Moves
- 6.3 Market Share Analysis
- 6.4 Company Profiles (includes Global Level Overview, Market Level Overview, Core Segments, Financials as available, Strategic Information, Market Rank/Share for key companies, Products and Services, and Recent Developments)
- 6.4.1 Crown Holdings Inc.
- 6.4.2 Silgan Holdings Inc.
- 6.4.3 Trivium Packaging
- 6.4.4 Toyo Seikan Group Holdings Ltd.
- 6.4.5 CANPACK S.A.
- 6.4.6 Sonoco Products Company
- 6.4.7 Ardagh Metal Packaging
- 6.4.8 Ball Corporation (Food Can Division)
- 6.4.9 Wells Can Company
- 6.4.10 Kian Joo Group
- 6.4.11 Visy Industries
- 6.4.12 Jamestrong Packaging
- 6.4.13 Colep Packaging
- 6.4.14 Aaron Packaging Inc.
- 6.4.15 CPMC Holdings Ltd.
- 6.4.16 Greif Inc.
- 6.4.17 Daeryuk Can Co. Ltd.
- 6.4.18 Huber Packaging Group
- 6.4.19 Crown Asia Pacific Holdings
- 6.4.20 HPM Packaging
7 MARKET OPPORTUNITIES AND FUTURE OUTLOOK
- 7.1 White-space and Unmet-need Assessment

