PUBLISHER: Mordor Intelligence | PRODUCT CODE: 2124306

PUBLISHER: Mordor Intelligence | PRODUCT CODE: 2124306
DC Circuit Breaker - Market Share Analysis, Industry Trends & Statistics, Growth Forecasts (2026 - 2031)
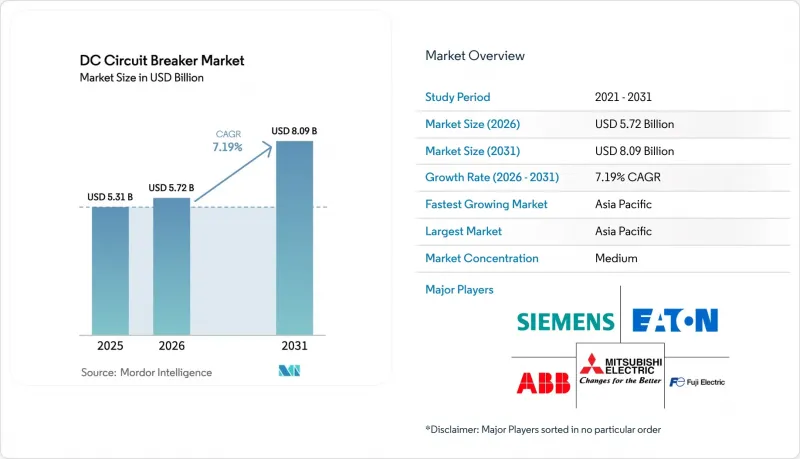
According to Mordor Intelligence, the DC circuit breaker market size is projected to be USD 5.31 billion in 2025, USD 5.72 billion in 2026, and reach USD 8.09 billion by 2031, growing at a CAGR of 7.19% from 2026 to 2031.
This report is Segmented by Type (Solid-State and Hybrid), Insulation Medium (Oil, Air, Vacuum, and Gas), Voltage Rating (Low Voltage, Medium Voltage, and High Voltage), Installation Location (Indoor and Outdoor), Operating Mechanism (Mechanical, and More), End-User (Transmission and Distribution Utilities, Rail and E-Mobility Infrastructure, and More), and Geography (North America, Asia-Pacific, and More).
Global DC Circuit Breaker Market Trends and Insights
Surge in Renewable-Linked DC Networks
Utility-scale solar and offshore wind farms increasingly export power on DC collection grids, producing fault currents that exceed the capability of AC switchgear. China reported that 68% of solar farms commissioned in 2025 used 1,500 VDC string inverters with embedded breakers, trimming balance-of-system costs by 12%. India tendered 15 GW of DC-coupled storage, requiring 3 kV vacuum breakers to secure lithium-ion arrays. North Sea developers now specify 320 kV collection platforms with hybrid breakers capable of 40 kA interruption in 2 milliseconds to avert cascade trips. The IEC draft amendment proposed in December 2025 will, once ratified, shorten certification cycles and spur broader uptake. Collectively, these investments strengthen the demand outlook for the DC circuit breaker market.
Rapid Build-Out of HVDC Transmission Corridors
HVDC lines are displacing long-distance AC corridors thanks to lower resistive losses. The Hami-Chongqing +-800 kV link, energized in 2024, uses 12 hybrid breakers at each terminal to isolate faults within 3 milliseconds. Hitachi Energy supplies breaker modules pairing a mechanical disconnect with silicon-carbide thyristors for 25 kA duties. Europe's Celtic Interconnector began construction in March 2025 and specifies vacuum breakers at both ends to enable black-start capability. Brazil's Madeira project will employ +-600 kV solid-state breakers to guard a 2,400 km corridor that exports 4 GW of hydropower. Such mega-projects underpin high-voltage revenue streams within the DC circuit breaker market.
Capital Premium of Solid-State & Hybrid Designs
Solid-state and hybrid breakers carry a 3-5X cost multiple versus mechanical vacuum units. A 52 kV hybrid pole can cost up to USD 580,000, stretching payback periods beyond 12 years for regulated utilities. India deferred solid-state deployment at three HVDC projects in 2025 due to capital constraints. Silicon-carbide wafer shortages pushed 2025 lead-times to 52 weeks and spot prices 35% above contract levels. Chinese suppliers now market mechanical-vacuum hybrids at USD 180,000-240,000, trading speed for affordability and winning 22% of Asia's medium-voltage orders in 2025.
Other drivers and restraints analyzed in the detailed report include:
- Grid-Modernization Programs in Ageing T&D Fleets
- Rail & Metro DC Electrification Pipelines
- Complex Fault-Clearing in Multi-Terminal DC Grids
For complete list of drivers and restraints, kindly check the Table Of Contents.
Segment Analysis
Solid-state breakers held 76.3% of the DC circuit breaker market in 2025, owing to sub-microsecond commutation paths that meet stringent HVDC grid requirements. The segment's continuous 0.3-0.5% conduction loss, however, equates to USD 180,000-280,000 in annual energy waste for a 25 kA unit, encouraging utilities to evaluate alternatives. Hybrid products route steady-state current through a zero-resistance vacuum contact and invoke a semiconductor path only during faults, cutting losses to 0.08%. ABB's installation along the Hami-Chongqing link in 2024 validated a 3-millisecond interruption time and demonstrated 15-year life expectancy.
Hybrid designs will expand at an 8.8% CAGR, 1.6 points above the overall DC circuit breaker market, as field-upgradeable modules lower first-cost barriers. Hitachi Energy's cartridge concept, launched in March 2025, lets operators add silicon-carbide stacks later, deferring up to USD 450,000 in capital. Eaton's wafer supply deal with Wolfspeed promises 22% cost reductions by 2027. Mechanical-only breakers remain relevant in low-voltage rail traction where 10-millisecond clearing suffices and pricing undercuts hybrids by 60%.
Vacuum units controlled 43.5% of 2025 revenue and will grow at a 7.7% CAGR as regulators ban SF6 in new installations. The DC circuit breaker market size tied to vacuum products is forecast to improve sharply once the EU restriction starts in 2026. Utilities value the vacuum's maintenance-free design and rapid dielectric recovery. ABB's SafeRing landed 1,800 orders within five months of its April 2025 debut.
Gas-insulated breakers, 24.5% of the mix in 2025, cling to high-voltage outdoor niches, but fluoronitrile-and-ketone blends now rival SF6 performance. Siemens Energy's blue GIS secured 12 converter-station contracts in 2025. Oil-filled designs declined to 18% share due to fire risk, and air-insulated units lost ground to vacuum units in data-center retrofits. Mitsubishi Electric's 84 kV vacuum interrupter, undergoing trials at Tokyo Electric, signals vacuum's upward voltage migration.
Complete Report Scope:
- By Type
- Solid-state
- Hybrid
- By Insulation Medium
- Oil
- Air
- Vacuum
- Gas (SF6 & alternatives)
- By Voltage Rating
- Low Voltage (Up to 1 kV)
- Medium Voltage (1 to 52 kV)
- High Voltage (Above 52 kV)
- By Installation Location
- Indoor
- Outdoor
- By Operating Mechanism
- Mechanical
- Solid-State Actuated
- Hybrid Electromechanical
- By End-User
- Transmission and Distribution Utilities
- Renewable and Energy-Storage Plants
- Rail and E-Mobility Infrastructure
- Commercial and Industrial Facilities
- Others
- By Geography
- North America
- United States
- Canada
- Mexico
- Europe
- Germany
- United Kingdom
- France
- Italy
- NORDIC Countries
- Russia
- Rest of Europe
- Asia-Pacific
- China
- India
- Japan
- South Korea
- ASEAN Countries
- Rest of Asia-Pacific
- South America
- Brazil
- Argentina
- Colombia
- Rest of South America
- Middle East and Africa
- Saudi Arabia
- United Arab Emirates
- South Africa
- Egypt
- Rest of Middle East and Africa
- North America
Geography Analysis
Asia-Pacific led the DC circuit breaker market with 39.7% share in 2025 and is forecast to register a 9.4% CAGR through 2031. China energized three +-800 kV corridors in 2024, each requiring 25 kA hybrids and a cumulative equipment spend above USD 180 million. India's 500 GW renewable target drives demand for 3 kV vacuum breakers at solar-storage nodes, while Vietnam's metro expansion stipulates 1,500 VDC protection across two major cities. Japan's 320-substation retrofit saved 9% traction energy and deferred USD 240 million in upgrades.
Europe secured a 28% share in 2025 and will rise at a 7.8% CAGR under SF6 bans and offshore wind interconnectors. Regulation 2024/573 boosts vacuum orders by 34%, and Germany's substation rule accelerates the removal of 18,000 legacy units. The Celtic Interconnector, valued at EUR 930 million, specifies vacuum breakers for black-start capability. Nordic HVDC links such as Hansa PowerBridge employ +-525 kV hybrids to stabilize continental flows.
North America held a 19% share in 2025 and is expected to post a 6.9% CAGR. The U.S. Grid Resilience Partnership carved out USD 770 million for DC microgrids, while California's SF6 limits bring forward vacuum retrofits. Hyperscale clusters in Virginia and Oregon now standardize 800 VDC racks, lifting low-voltage demand. South America, the Middle East, and Africa together accounted for a 13.3% share and will grow at an 8.1% CAGR, supported by Brazil's Madeira HVDC project and Saudi Arabia's NEOM renewable hub.
- ABB
- Siemens Energy
- Eaton
- Mitsubishi Electric
- Schneider Electric
- Hitachi Energy
- Toshiba Energy Systems
- Rockwell Automation
- Larsen & Toubro
- LS Electric
- Fuji Electric
- Hyundai Electric
- Powell Industries
- Nader Electric
- Entec Electric & Electronic
- GEYA Electrical
- Chint Group
- Hughes Power System
- ABB (Gerapid) Rail Solutions
- Siemens (DCB series)
Additional Benefits:
- The market estimate (ME) sheet in Excel format
- 3 months of analyst support
TABLE OF CONTENTS
1 Introduction
- 1.1 Study Assumptions & Market Definition
- 1.2 Scope of the Study
2 Research Methodology
3 Executive Summary
4 Market Landscape
- 4.1 Market Overview
- 4.2 Market Drivers
- 4.2.1 Surge in renewable-linked DC networks
- 4.2.2 Rapid build-out of HVDC transmission corridors
- 4.2.3 Grid-modernization programs in ageing T&D fleets
- 4.2.4 Rail & metro DC electrification pipelines
- 4.2.5 Data-center shift toward on-prem LVDC busways
- 4.2.6 Policy bans on SF6 spurring vacuum & solid-state DC CB uptake
- 4.3 Market Restraints
- 4.3.1 Capital premium of solid-state & hybrid designs
- 4.3.2 Complex fault-clearing in multi-terminal DC grids
- 4.3.3 Absence of universal DC-protection standards
- 4.3.4 Wide-band-gap semiconductor supply bottlenecks
- 4.4 Supply-Chain Analysis
- 4.5 Regulatory Landscape
- 4.6 Technological Outlook
- 4.7 Porter's Five Forces
- 4.7.1 Bargaining Power of Suppliers
- 4.7.2 Bargaining Power of Buyers
- 4.7.3 Threat of New Entrants
- 4.7.4 Threat of Substitutes
- 4.7.5 Competitive Rivalry
5 Market Size & Growth Forecasts
- 5.1 By Type
- 5.1.1 Solid-state
- 5.1.2 Hybrid
- 5.2 By Insulation Medium
- 5.2.1 Oil
- 5.2.2 Air
- 5.2.3 Vacuum
- 5.2.4 Gas (SF6 & alternatives)
- 5.3 By Voltage Rating
- 5.3.1 Low Voltage (Up to 1 kV)
- 5.3.2 Medium Voltage (1 to 52 kV)
- 5.3.3 High Voltage (Above 52 kV)
- 5.4 By Installation Location
- 5.4.1 Indoor
- 5.4.2 Outdoor
- 5.5 By Operating Mechanism
- 5.5.1 Mechanical
- 5.5.2 Solid-State Actuated
- 5.5.3 Hybrid Electromechanical
- 5.6 By End-User
- 5.6.1 Transmission and Distribution Utilities
- 5.6.2 Renewable and Energy-Storage Plants
- 5.6.3 Rail and E-Mobility Infrastructure
- 5.6.4 Commercial and Industrial Facilities
- 5.6.5 Others
- 5.7 By Geography
- 5.7.1 North America
- 5.7.1.1 United States
- 5.7.1.2 Canada
- 5.7.1.3 Mexico
- 5.7.2 Europe
- 5.7.2.1 Germany
- 5.7.2.2 United Kingdom
- 5.7.2.3 France
- 5.7.2.4 Italy
- 5.7.2.5 NORDIC Countries
- 5.7.2.6 Russia
- 5.7.2.7 Rest of Europe
- 5.7.3 Asia-Pacific
- 5.7.3.1 China
- 5.7.3.2 India
- 5.7.3.3 Japan
- 5.7.3.4 South Korea
- 5.7.3.5 ASEAN Countries
- 5.7.3.6 Rest of Asia-Pacific
- 5.7.4 South America
- 5.7.4.1 Brazil
- 5.7.4.2 Argentina
- 5.7.4.3 Colombia
- 5.7.4.4 Rest of South America
- 5.7.5 Middle East and Africa
- 5.7.5.1 Saudi Arabia
- 5.7.5.2 United Arab Emirates
- 5.7.5.3 South Africa
- 5.7.5.4 Egypt
- 5.7.5.5 Rest of Middle East and Africa
- 5.7.1 North America
6 Competitive Landscape
- 6.1 Market Concentration
- 6.2 Strategic Moves (M&A, Partnerships, PPAs)
- 6.3 Market Share Analysis (Market Rank/Share for key companies)
- 6.4 Company Profiles (includes Global level Overview, Market level overview, Core Segments, Financials as available, Strategic Information, Products & Services, and Recent Developments)
- 6.4.1 ABB
- 6.4.2 Siemens Energy
- 6.4.3 Eaton
- 6.4.4 Mitsubishi Electric
- 6.4.5 Schneider Electric
- 6.4.6 Hitachi Energy
- 6.4.7 Toshiba Energy Systems
- 6.4.8 Rockwell Automation
- 6.4.9 Larsen & Toubro
- 6.4.10 LS Electric
- 6.4.11 Fuji Electric
- 6.4.12 Hyundai Electric
- 6.4.13 Powell Industries
- 6.4.14 Nader Electric
- 6.4.15 Entec Electric & Electronic
- 6.4.16 GEYA Electrical
- 6.4.17 Chint Group
- 6.4.18 Hughes Power System
- 6.4.19 ABB (Gerapid) Rail Solutions
- 6.4.20 Siemens (DCB series)
7 Market Opportunities & Future Outlook
- 7.1 White-Space & Unmet-Need Assessment

