PUBLISHER: Mordor Intelligence | PRODUCT CODE: 2124362

PUBLISHER: Mordor Intelligence | PRODUCT CODE: 2124362
End User Computing - Market Share Analysis, Industry Trends & Statistics, Growth Forecasts (2026 - 2031)
According to Mordor Intelligence, the end-User computing market size was valued at USD 13.17 billion in 2025 and estimated to grow from USD 14.47 billion in 2026 to reach USD 23.2 billion by 2031, at a CAGR of 9.89% during the forecast period (2026-2031).
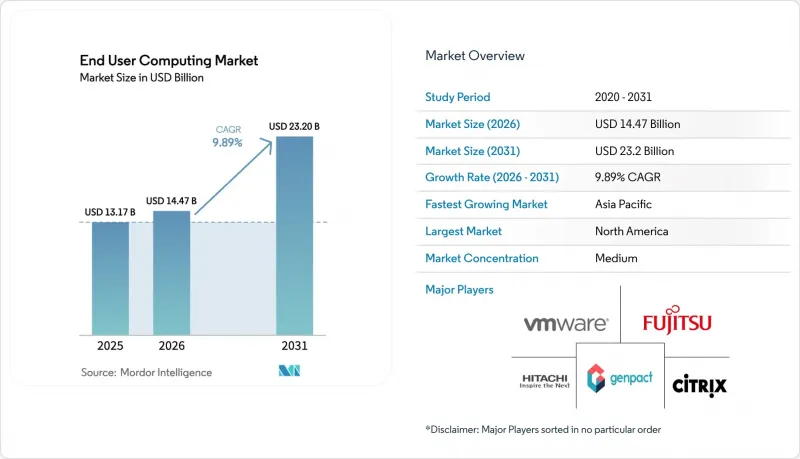
This report is Segmented by Product Type( Virtual Desktop Infrastructure, and More), Organization Size (Large Enterprises, and More), Deployment Mode (On-Premise, Cloud, Hybrid), End User Industry (IT and Telecom, Banking Financial Services and Insurance, and More), Delivery Model (Virtual Desktop Infrastructure, and More), and Geography. The Market Forecasts are Provided in Terms of Value (USD).
Global End User Computing Market Trends and Insights
Drive to Increase Employee Productivity via Digital Workspaces
Enterprises are reimagining productivity by combining virtual desktops, collaboration suites, and AI copilots inside a single digital workspace. Organizations that reach advanced workplace maturity levels report a 57.8% boost in positive employee experience metrics, thanks to quicker access to resources, app self-service, and uniform security controls. Microsoft's early field data shows AI copilots save roughly 10 hours per employee each month, translating into tangible capacity gains. The result is a measurable uplift in innovation, inclusion, and well-being, as seamless device hopping and automated workflows reduce friction and burnout.
Growing Adoption of Cloud-Based Desktop and Application Virtualization
Consumption-based desktop hosting is scaling fast because it eliminates capital expenditure and shortens deployment timelines from months to days. Azure Virtual Desktop production use already spans 26% of surveyed organizations, with 58% planning rollouts within the next two years, driven by policy-based scaling, pay-as-you-go pricing, and native Microsoft 365 integration. Healthcare providers illustrate the upside: browser-delivered desktops logged sub-minute sign-ins, freeing clinicians to spend more time with patients and less on IT wait states.
Complexity Integrating EUC with Legacy Applications and Infrastructure
Banks, hospitals, and government agencies still depend on thick-client applications tied to specific OS versions, hard-coded drive mappings, or serial-port peripherals. Virtual desktops must replicate these dependencies while guaranteeing millisecond response times in mission-critical workflows. Integration projects therefore add middleware, APIs, and parallel test environments, extending timelines and inflating costs. Change-management gaps further undermine ROI; 73% of employees who move to digital workspaces without structured training feel disengaged, risking project rollback. Firms mitigate the drag by phasing workloads, rewriting monoliths into modular services, and introducing user-experience analytics that flag adoption bottlenecks early.
Other drivers and restraints analyzed in the detailed report include:
- Rising BYOD Policies and Mobile Workforce Requiring Unified Endpoint Management
- Windows-10 End-of-Support Triggering Enterprise PC Refresh Cycles
- High Upfront Transformation Costs for VDI and DaaS Migrations
For complete list of drivers and restraints, kindly check the Table Of Contents.
Segment Analysis
Solutions retained 60.45% End User Computing market share in 2025, underpinned by mature VDI platforms, device-management suites, and software-asset tools that together generated roughly USD 8 billion in annual recurring revenue. Vendors use unified consoles to orchestrate endpoints, apps, and security, which simplifies compliance audits across thousands of assets. Growth now skews toward managed services, with a 10.05% CAGR, as enterprises prefer outcome-based contracts that offload patching, scaling, and experience monitoring to specialists.
Managed service providers embed AI-driven observability and self-healing capabilities, enabling customers to transition from firefighting tickets to proactive optimization. Healthcare customers, for instance, adopt Device-as-a-Service bundles that convert capex to predictable opex and deliver pre-configured clinical workstations on 36-month refresh cycles, reducing help-desk volumes by double-digit percentages.
Large enterprises controlled 45.85% of End User Computing market size in 2025 and rely on tailored integrations, zero-trust overlays, and global federated identity to secure tens of thousands of users. Concurrent licensing and in-house talent give them lower per-seat operating costs, yet hardware refresh mandates and AI upgrade cycles force continual reinvestment.
SMEs, conversely, expand at 10.25% CAGR because cloud-native desktops remove the need for data-center space or specialized staff. Browser-launched workspaces deploy in under 48 hours and include automatic scaling, backup, and compliance templates. For many SMEs the Windows 10 sunset is a trigger to jump straight to cloud desktops, avoiding hardware outlays and accessing Windows 11-ready environments instantly.
Complete Report Scope:
- By Product Type
- Solutions
- Virtual Desktop Infrastructure
- Device Management
- Unified Communication
- Software Asset Management
- Services
- Solutions
- By Organization Size
- Large Enterprises
- Small and Medium Enterprises
- By Deployment Mode
- On-Premise
- Cloud
- Hybrid
- By End User Industry
- IT and Telecom
- Banking, Financial Services and Insurance
- Healthcare
- Retail
- Government
- Education
- Transportation and Logistics
- By Delivery Model
- Virtual Desktop Infrastructure
- Desktop-as-a-Service
- Cloud Workspaces
- Enterprise Mobility Management
- By Geography
- North America
- United States
- Canada
- Mexico
- South America
- Brazil
- Argentina
- Rest of South America
- Europe
- United Kingdom
- Germany
- France
- Italy
- Spain
- Russia
- Rest of Europe
- Asia Pacific
- China
- India
- Japan
- South Korea
- Southeast Asia
- Rest of Asia Pacific
- Middle East
- Saudi Arabia
- United Arab Emirates
- Turkey
- Rest of Middle East
- Africa
- South Africa
- North Africa
- Rest of Africa
- North America
Geography Analysis
The Asia Pacific controlled 62.40% of the End-User Computing market in 2025 and is projected to post a regional 10.72% CAGR from 2026 to 2031. A Zoho survey reveals that APAC organizations have achieved a 66.35% digital workplace maturity score, five points above the global average, with 76% reaching advanced levels. Penetration of AI-enabled tools (54%) and team chat (72%) epitomizes a mobile-first mentality, while steady 5G rollouts create fertile ground for edge-enhanced virtual desktops.
North America exhibits entrenched VDI estates across regulated sectors and leads the early adoption of AI copilots, which save roughly 10 hours per user per month. The Windows 10 cutoff brings an immediate refresh wave that favors modern endpoint management and DaaS. Europe mirrors the pattern but adds stringent GDPR mandates, steering multinationals toward hybrid deployments that balance local data residency with global cloud scale.
Emerging markets in the Middle East, Africa, and Latin America treat cloud desktops as a leapfrog opportunity to bypass legacy infrastructure. Consumption models align with budget constraints, while telco-edge collaborations promise sub-20-millisecond latency for immersive field maintenance or remote-assistance scenarios. Governments increasingly codify data-localization rules, encouraging regional cloud zones and sovereign VDI stacks that can interconnect with global platforms.
- Omnissa (VMware EUC)
- Citrix Systems Inc.
- Microsoft Corporation
- Amazon Web Services Inc.
- Dell Technologies Inc.
- Lenovo Group Ltd.
- HP Inc.
- Nutanix Inc.
- Fujitsu Ltd.
- Genpact Ltd.
- HCL Infosystems Ltd.
- Infosys Ltd.
- LTIMindtree Ltd.
- NetApp Inc.
- Tech Mahindra Ltd.
- Hitachi
- IGEL Technology GmbH
- Parallels International GmbH
- Nerdio Inc.
- ControlUp Inc.
- Cisco Systems Inc.
- Google LLC
Additional Benefits:
- The market estimate (ME) sheet in Excel format
- 3 months of analyst support
TABLE OF CONTENTS
1 INTRODUCTION
- 1.1 Study Assumptions and Market Definition
- 1.2 Scope of the Study
2 RESEARCH METHODOLOGY
3 EXECUTIVE SUMMARY
4 MARKET LANDCSAPE
- 4.1 Market Overview
- 4.2 Market Drivers
- 4.2.1 Drive to Increase Employee Productivity via Digital Workspaces
- 4.2.2 Growing Adoption of Cloud-Based Desktop and Application Virtualization
- 4.2.3 Rising BYOD Policies and Mobile Workforce Requiring Unified Endpoint Management
- 4.2.4 Windows-10 End-of-Support Triggering Enterprise PC Refresh Cycles
- 4.2.5 Emergence of AI-Capable Endpoints Enabling On-Device GenAI Workloads
- 4.2.6 Telco Edge-Cloud Partnerships Enabling Ultra-Low-Latency EUC for Field AR-VR
- 4.3 Market Restraints
- 4.3.1 Complexity Integrating EUC with Legacy Applications and Infrastructure
- 4.3.2 High Upfront Transformation Costs for VDI and DaaS Migrations
- 4.3.3 Vendor Consolidation-Driven License Uncertainty (e.g., VMware EUC Divestiture)
- 4.3.4 Data Sovereignty Concerns Hindering Full Cloud EUC Adoption
- 4.4 Impact of Macroeconomic Factors
- 4.5 Industry Value / Supply-Chain Analysis
- 4.6 Regulatory Landscape
- 4.7 Technological Outlook
- 4.8 Porter's Five Forces Analysis
- 4.8.1 Bargaining Power of Suppliers
- 4.8.2 Bargaining Power of Consumers
- 4.8.3 Threat of New Entrants
- 4.8.4 Threat of Substitutes
- 4.8.5 Intensity of Competitive Rivalry
5 MARKET SIZE AND GROWTH FORECASTS (VALUE)
- 5.1 By Product Type
- 5.1.1 Solutions
- 5.1.1.1 Virtual Desktop Infrastructure
- 5.1.1.2 Device Management
- 5.1.1.3 Unified Communication
- 5.1.1.4 Software Asset Management
- 5.1.2 Services
- 5.1.1 Solutions
- 5.2 By Organization Size
- 5.2.1 Large Enterprises
- 5.2.2 Small and Medium Enterprises
- 5.3 By Deployment Mode
- 5.3.1 On-Premise
- 5.3.2 Cloud
- 5.3.3 Hybrid
- 5.4 By End User Industry
- 5.4.1 IT and Telecom
- 5.4.2 Banking, Financial Services and Insurance
- 5.4.3 Healthcare
- 5.4.4 Retail
- 5.4.5 Government
- 5.4.6 Education
- 5.4.7 Transportation and Logistics
- 5.5 By Delivery Model
- 5.5.1 Virtual Desktop Infrastructure
- 5.5.2 Desktop-as-a-Service
- 5.5.3 Cloud Workspaces
- 5.5.4 Enterprise Mobility Management
- 5.6 By Geography
- 5.6.1 North America
- 5.6.1.1 United States
- 5.6.1.2 Canada
- 5.6.1.3 Mexico
- 5.6.2 South America
- 5.6.2.1 Brazil
- 5.6.2.2 Argentina
- 5.6.2.3 Rest of South America
- 5.6.3 Europe
- 5.6.3.1 United Kingdom
- 5.6.3.2 Germany
- 5.6.3.3 France
- 5.6.3.4 Italy
- 5.6.3.5 Spain
- 5.6.3.6 Russia
- 5.6.3.7 Rest of Europe
- 5.6.4 Asia Pacific
- 5.6.4.1 China
- 5.6.4.2 India
- 5.6.4.3 Japan
- 5.6.4.4 South Korea
- 5.6.4.5 Southeast Asia
- 5.6.4.6 Rest of Asia Pacific
- 5.6.5 Middle East
- 5.6.5.1 Saudi Arabia
- 5.6.5.2 United Arab Emirates
- 5.6.5.3 Turkey
- 5.6.5.4 Rest of Middle East
- 5.6.6 Africa
- 5.6.6.1 South Africa
- 5.6.6.2 North Africa
- 5.6.6.3 Rest of Africa
- 5.6.1 North America
6 COMPETITIVE LANDSCAPE
- 6.1 Market Concentration
- 6.2 Strategic Moves
- 6.3 Market Share Analysis
- 6.4 Company Profiles {(includes Global level Overview, Market level overview, Core Segments, Financials as available, Strategic Information, Market Rank/Share for key companies, Products and Services, and Recent Developments)}
- 6.4.1 Omnissa (VMware EUC)
- 6.4.2 Citrix Systems Inc.
- 6.4.3 Microsoft Corporation
- 6.4.4 Amazon Web Services Inc.
- 6.4.5 Dell Technologies Inc.
- 6.4.6 Lenovo Group Ltd.
- 6.4.7 HP Inc.
- 6.4.8 Nutanix Inc.
- 6.4.9 Fujitsu Ltd.
- 6.4.10 Genpact Ltd.
- 6.4.11 HCL Infosystems Ltd.
- 6.4.12 Infosys Ltd.
- 6.4.13 LTIMindtree Ltd.
- 6.4.14 NetApp Inc.
- 6.4.15 Tech Mahindra Ltd.
- 6.4.16 Hitachi
- 6.4.17 IGEL Technology GmbH
- 6.4.18 Parallels International GmbH
- 6.4.19 Nerdio Inc.
- 6.4.20 ControlUp Inc.
- 6.4.21 Cisco Systems Inc.
- 6.4.22 Google LLC
7 MARKET OPPORTUNITIES AND FUTURE OUTLOOK
- 7.1 White-Space and Unmet-Need Assessment

