PUBLISHER: Mordor Intelligence | PRODUCT CODE: 2124409

PUBLISHER: Mordor Intelligence | PRODUCT CODE: 2124409
Africa Packaging - Market Share Analysis, Industry Trends & Statistics, Growth Forecasts (2026 - 2031)
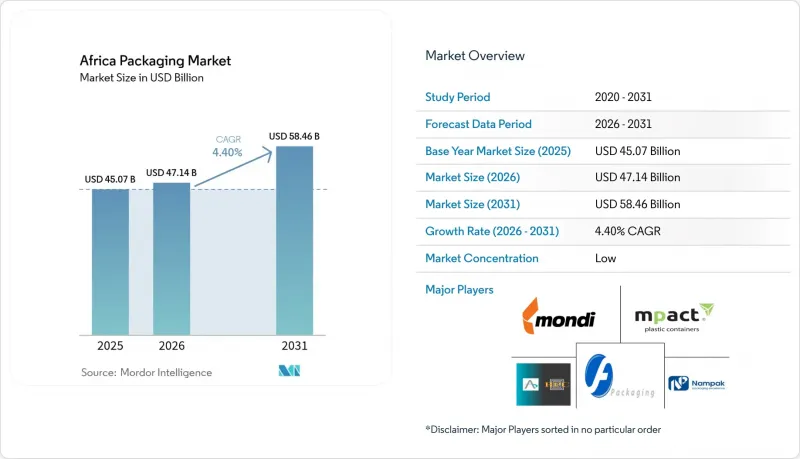
According to Mordor Intelligence, the Africa packaging market size is expected to grow from USD 45.07 billion in 2025 to USD 47.14 billion in 2026 and is forecast to reach USD 58.46 billion by 2031 at a 4.4% CAGR over 2026-2031.
This report is Segmented by Packaging Type (Plastic, Paper, Container Glass, and Metal Cans), Packaging Format (Rigid, and Flexible), End-Use Industry (Food, Beverage, Pharmaceuticals, Personal Care, Industrial, and E-Commerce), and Geography (Egypt, Nigeria, Kenya, South Africa, Rest of Africa). The Market Forecasts are Provided in Terms of Value (USD).
Africa Packaging Market Trends and Insights
Growing Urban Middle Class Boosting FMCG Consumption
Rapid urban migration is concentrating purchasing power in cities, driving demand for portion-controlled sachets and stand-up pouches that match lower per-transaction spending limits.Multinationals are localizing production to cut logistics costs and respond faster to city-level taste shifts, as evidenced by Unilever's USD 85 million flexible-pack line commissioned in Lagos in 2024. Mini-supermarket expansion in peri-urban areas is accelerating the switch from bulk to pre-packaged goods, with sachets accounting for up to 50% of unit sales in Nigeria and Kenya. Rising disposable incomes are encouraging premium pack upgrades such as aseptic cartons, yet affordability considerations mean pack-size innovation remains the principal growth lever. The demographic dividend therefore underpins steady baseline demand that tempers cyclical stocks in commodity-linked segments.
E-commerce Packaging Demand Surge
Online retail's share of South African sales reached 7.2% in 2025, while Kenya's e-commerce value rose 18% year on year, reshaping corrugated-box specifications for rapid fulfilment and cross-border shipping. Jumia's new fulfilment centers across West and East Africa added 120,000 m2 of warehouse space and drove requirements for digitally printed boxes with tamper-evident features. Platforms are setting recycled-content thresholds, prompting converters to invest in recovered-fiber supply and digital corrugators capable of short runs. Social-commerce growth is boosting demand for branded mailers and padded envelopes, an underserved niche that expanded 22% in 2025. Absence of uniform waste regulations poses a risk of landfill levies but also a service opportunity for converters offering take-back schemes.
Volatile Polymer and Paper-Pulp Prices
Polyethylene prices in South Africa oscillated between ZAR 18,500 and ZAR 24,200 t-1 in 2024-2025, shrinking converter margins by up to 12%. With 70% of sub-Saharan resin imported, freight-rate swings and forex shifts have direct P&L impact, illustrated by a six-week supply delay after Red Sea disruptions in late 2024. Paper-pulp costs climbed 11% in 2025 as global supply tightened, compelling box makers to import kraft liner at an 18% premium. Limited hedging tools in African financial hubs expose small converters to spot-price shocks, reinforcing a flight to scale and vertical integration.
Other drivers and restraints analyzed in the detailed report include:
- Government Bans on Single-Use Plastics Driving Alternative Materials
- Rise of Cold-Chain Logistics for Fresh-Produce Exports
- Power-Supply Instability Increasing Plant OPEX
For complete list of drivers and restraints, kindly check the Table Of Contents.
Segment Analysis
Plastic formats supplied 48.19% of Africa packaging market revenue in 2025, underpinned by polyethylene for shopping bags and dairy sachets, PET for beverages and polypropylene for hot-fill applications, yet biodegradable alternatives are projected to grow at 4.91% CAGR as single-use bans tighten. South Africa's 68% PET recycling rate, the highest on the continent, exemplifies how deposit-return schemes can sustain polymer use within circular models. Biodegradable take-up remains constrained by limited composting hubs that handle only a fraction of projected PLA tonnage, yet pilot programs suggest scalable pathways once collection matures. Paper claimed 28% share in 2025, buoyed by corrugated demand from e-commerce and folding cartons for dry foods, while glass and metal retained niche positions in premium beverages and on-premises consumption.
Rigid plastics such as PET bottles and HDPE containers dominate volume but rely on capital-intensive blow-moulding lines that favour incumbents, restraining rapid format shifts. Flexible plastics, led by stand-up pouches, are growing faster because they cut material usage by up to 40% and fit portion-size requirements in urban informal retail. Brand owners are piloting mono-material laminates that meet recyclability mandates, yet barrier-performance trade-offs limit adoption for moisture-sensitive snacks. Kraft-liner shortages in 2025 drove corrugated producers to increase recycled-fiber ratios to 85%, raising strength concerns in humid climates.
Complete Report Scope:
- By Packaging Type
- Plastic Packaging
- Rigid Plastic Packaging
- By Material Type
- Polyethylene (PE)
- Polypropylene (PP)
- Polyethylene Terephthalate (PET)
- Polyvinyl Chloride (PVC)
- Polystyrene (PS) and Expanded PS
- Other Material Types
- By Product Type
- Bottles and Jars
- Caps and Closures
- Trays and Containers
- Other Product Types
- By End-use Industry
- Food
- Beverage
- Pharmaceutical
- Cosmetics and Personal Care
- Industrial
- Other End-use Industry
- By Material Type
- Flexible Plastic Packaging
- By Material Type
- Polyethylene (PE)
- Biaxially Oriented Polypropylene (BOPP)
- Cast Polypropylene (CPP)
- Other Material Types
- By Product Type
- Pouches and Bags
- Films and Wraps
- Other Product Types
- By End-use Industry
- Food
- Beverage
- Pharmaceutical
- Cosmetics and Personal Care
- Industrial
- Other End-use Industry
- By Material Type
- Rigid Plastic Packaging
- Paper Packaging
- By Product Type
- Folding Carton
- Corrugated Boxes
- Liquid Paperboard
- Other Product Type
- By End-use Industry
- Food
- Beverage
- E-commerce
- Other End-use Industry
- By Product Type
- Container Glass
- By Color
- Green
- Amber
- Flint
- Other Colors
- By End-use Industry
- Food
- Beverage
- Alcoholic
- Non-Alcoholic
- Personal Care and Cosmetics
- Pharmaceuticals (Excl. Vials and Ampoules)
- Perfumery
- By Color
- Metal Cans and Containers
- By Material Type
- Steel
- Aluminum
- By Product Type
- Cans
- Drums and Barrels
- Caps and Closures
- Other Product Type
- By End-use Industry
- Food
- Beverage
- Chemicals and Petroleum
- Industrial
- Paints and Coatings
- Other End-use Industry
- By Material Type
- Plastic Packaging
- By Packaging Format
- Rigid
- Flexible
- By End-Use Industry
- Food
- Beverage
- Pharmaceuticals and Healthcare
- Personal Care and Cosmetics
- Industrial
- E-commerce
- Other End-use Industry
- By Country
- Egypt
- Nigeria
- Kenya
- South Africa
- Rest of Africa
List of Companies Covered in this Report:
- Amcor plc
- Mondi plc
- Nampak Ltd
- Mpact Ltd
- Tetra Pak International SA
- Sealed Air Corp.
- Constantia Flexibles Group GmbH
- Consol Holdings (Pty) Ltd
- Astrapak Ltd
- Foster Packaging International (Pty) Ltd
- East African Packaging Industries Ltd
- Bonpak (Pty) Ltd
- Huhtamaki Oyj
- Ardagh Group SA
- Smurfit WestRock
- Novus Holdings Ltd
- Greif Inc.
- Sonoco Products Company
- Frigoglass SAIC
Additional Benefits:
- The market estimate (ME) sheet in Excel format
- 3 months of analyst support
TABLE OF CONTENTS
1 INTRODUCTION
- 1.1 Study Assumptions and Market Definition
- 1.2 Scope of the Study
2 RESEARCH METHODOLOGY
3 EXECUTIVE SUMMARY
4 MARKET LANDSCAPE
- 4.1 Market Overview
- 4.2 Market Drivers
- 4.2.1 Growing Urban Middle Class Boosting FMCG Consumption
- 4.2.2 E-commerce Packaging Demand Surge
- 4.2.3 Expansion of Modern Retail Chains Across Africa
- 4.2.4 Government Bans on Single-Use Plastics Driving Alternative Materials
- 4.2.5 Rise of Cold-Chain Logistics for Fresh-Produce Exports
- 4.2.6 AfCFTA Trade Corridors Spurring Demand for Returnable Transit Packaging
- 4.3 Market Restraints
- 4.3.1 Volatile Polymer and Paper-Pulp Prices
- 4.3.2 Power-Supply Instability Increasing Plant OPEX
- 4.3.3 Port Congestion Delaying Raw-Material Inflows
- 4.3.4 Inadequate Recycling Infrastructure Limiting rPET Uptake
- 4.4 Impact of Macroeconomic Factors on the Market
- 4.5 Industry Value-Chain Analysis
- 4.6 Regulatory Landscape
- 4.7 Technological Outlook
- 4.8 Porter's Five Forces Analysis
- 4.8.1 Bargaining Power of Suppliers
- 4.8.2 Bargaining Power of Buyers
- 4.8.3 Threat of New Entrants
- 4.8.4 Intensity of Competitive Rivalry
- 4.8.5 Threat of Substitutes
- 4.9 Investment Analysis
- 4.10 Overview of the Global Packaging Market
5 MARKET SIZE AND GROWTH FORECASTS (VALUE)
- 5.1 By Packaging Type
- 5.1.1 Plastic Packaging
- 5.1.1.1 Rigid Plastic Packaging
- 5.1.1.1.1 By Material Type
- 5.1.1.1.1.1 Polyethylene (PE)
- 5.1.1.1.1.2 Polypropylene (PP)
- 5.1.1.1.1.3 Polyethylene Terephthalate (PET)
- 5.1.1.1.1.4 Polyvinyl Chloride (PVC)
- 5.1.1.1.1.5 Polystyrene (PS) and Expanded PS
- 5.1.1.1.1.6 Other Material Types
- 5.1.1.1.2 By Product Type
- 5.1.1.1.2.1 Bottles and Jars
- 5.1.1.1.2.2 Caps and Closures
- 5.1.1.1.2.3 Trays and Containers
- 5.1.1.1.2.4 Other Product Types
- 5.1.1.1.3 By End-use Industry
- 5.1.1.1.3.1 Food
- 5.1.1.1.3.2 Beverage
- 5.1.1.1.3.3 Pharmaceutical
- 5.1.1.1.3.4 Cosmetics and Personal Care
- 5.1.1.1.3.5 Industrial
- 5.1.1.1.3.6 Other End-use Industry
- 5.1.1.1.1 By Material Type
- 5.1.1.2 Flexible Plastic Packaging
- 5.1.1.2.1 By Material Type
- 5.1.1.2.1.1 Polyethylene (PE)
- 5.1.1.2.1.2 Biaxially Oriented Polypropylene (BOPP)
- 5.1.1.2.1.3 Cast Polypropylene (CPP)
- 5.1.1.2.1.4 Other Material Types
- 5.1.1.2.2 By Product Type
- 5.1.1.2.2.1 Pouches and Bags
- 5.1.1.2.2.2 Films and Wraps
- 5.1.1.2.2.3 Other Product Types
- 5.1.1.2.3 By End-use Industry
- 5.1.1.2.3.1 Food
- 5.1.1.2.3.2 Beverage
- 5.1.1.2.3.3 Pharmaceutical
- 5.1.1.2.3.4 Cosmetics and Personal Care
- 5.1.1.2.3.5 Industrial
- 5.1.1.2.3.6 Other End-use Industry
- 5.1.1.2.1 By Material Type
- 5.1.1.1 Rigid Plastic Packaging
- 5.1.2 Paper Packaging
- 5.1.2.1 By Product Type
- 5.1.2.1.1 Folding Carton
- 5.1.2.1.2 Corrugated Boxes
- 5.1.2.1.3 Liquid Paperboard
- 5.1.2.1.4 Other Product Type
- 5.1.2.2 By End-use Industry
- 5.1.2.2.1 Food
- 5.1.2.2.2 Beverage
- 5.1.2.2.3 E-commerce
- 5.1.2.2.4 Other End-use Industry
- 5.1.2.1 By Product Type
- 5.1.3 Container Glass
- 5.1.3.1 By Color
- 5.1.3.1.1 Green
- 5.1.3.1.2 Amber
- 5.1.3.1.3 Flint
- 5.1.3.1.4 Other Colors
- 5.1.3.2 By End-use Industry
- 5.1.3.2.1 Food
- 5.1.3.2.2 Beverage
- 5.1.3.2.2.1 Alcoholic
- 5.1.3.2.2.2 Non-Alcoholic
- 5.1.3.2.3 Personal Care and Cosmetics
- 5.1.3.2.4 Pharmaceuticals (Excl. Vials and Ampoules)
- 5.1.3.2.5 Perfumery
- 5.1.3.1 By Color
- 5.1.4 Metal Cans and Containers
- 5.1.4.1 By Material Type
- 5.1.4.1.1 Steel
- 5.1.4.1.2 Aluminum
- 5.1.4.2 By Product Type
- 5.1.4.2.1 Cans
- 5.1.4.2.2 Drums and Barrels
- 5.1.4.2.3 Caps and Closures
- 5.1.4.2.4 Other Product Type
- 5.1.4.3 By End-use Industry
- 5.1.4.3.1 Food
- 5.1.4.3.2 Beverage
- 5.1.4.3.3 Chemicals and Petroleum
- 5.1.4.3.4 Industrial
- 5.1.4.3.5 Paints and Coatings
- 5.1.4.3.6 Other End-use Industry
- 5.1.4.1 By Material Type
- 5.1.1 Plastic Packaging
- 5.2 By Packaging Format
- 5.2.1 Rigid
- 5.2.2 Flexible
- 5.3 By End-Use Industry
- 5.3.1 Food
- 5.3.2 Beverage
- 5.3.3 Pharmaceuticals and Healthcare
- 5.3.4 Personal Care and Cosmetics
- 5.3.5 Industrial
- 5.3.6 E-commerce
- 5.3.7 Other End-use Industry
- 5.4 By Country
- 5.4.1 Egypt
- 5.4.2 Nigeria
- 5.4.3 Kenya
- 5.4.4 South Africa
- 5.4.5 Rest of Africa
6 COMPETITIVE LANDSCAPE
- 6.1 Market Concentration
- 6.2 Strategic Moves
- 6.3 Market Share Analysis
- 6.4 Company Profiles (includes Global Level Overview, Market Level Overview, Core Segments, Financials as available, Strategic Information, Market Rank/Share, Products and Services, Recent Developments)
- 6.4.1 Amcor plc
- 6.4.2 Mondi plc
- 6.4.3 Nampak Ltd
- 6.4.4 Mpact Ltd
- 6.4.5 Tetra Pak International SA
- 6.4.6 Sealed Air Corp.
- 6.4.7 Constantia Flexibles Group GmbH
- 6.4.8 Consol Holdings (Pty) Ltd
- 6.4.9 Astrapak Ltd
- 6.4.10 Foster Packaging International (Pty) Ltd
- 6.4.11 East African Packaging Industries Ltd
- 6.4.12 Bonpak (Pty) Ltd
- 6.4.13 Huhtamaki Oyj
- 6.4.14 Ardagh Group SA
- 6.4.15 Smurfit WestRock
- 6.4.16 Novus Holdings Ltd
- 6.4.17 Greif Inc.
- 6.4.18 Sonoco Products Company
- 6.4.19 Frigoglass SAIC
7 MARKET OPPORTUNITIES AND FUTURE OUTLOOK
- 7.1 White-space and Unmet-Need Assessment

