PUBLISHER: Mordor Intelligence | PRODUCT CODE: 2124462

PUBLISHER: Mordor Intelligence | PRODUCT CODE: 2124462
Big Data Engineering Services - Market Share Analysis, Industry Trends & Statistics, Growth Forecasts (2026 - 2031)
According to Mordor Intelligence, the big data engineering services market size is expected to grow from USD 91.54 billion in 2025 to USD 105.38 billion in 2026 and is forecast to reach USD 213.07 billion by 2031 at a 15.12% CAGR over 2026-2031.
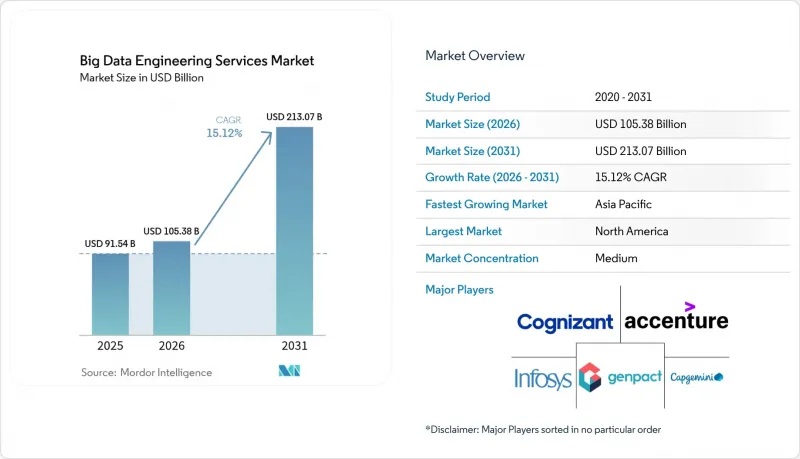
This report is Segmented by Service Type (Data Integration and ETL, Data Quality and Governance, and More), Business Function (Marketing and Sales, Finance, Operations and Supply-Chain, Human Resources), Organization Size (Small and Medium Enterprises, and Large Enterprises), Deployment Mode (Cloud, On-Premises, Hybrid), and Geography. The Market Forecasts are Provided in Terms of Value (USD).
Global Big Data Engineering Services Market Trends and Insights
Proliferation of Unstructured IoT and Social Data
Enterprises now ingest millisecond sensor readings, surveillance video, and conversational transcripts that together surpassed 181 zettabytes in 2025. Manufacturing lines stream vibration metrics from every robotic joint to remote object stores, while retailers fuse ceiling-mounted camera feeds with point-of-sale receipts to refine planograms. Social channels add sentiment signals that marketers activate within minutes, forcing a pivot from nightly batches to continuous pipelines. Schema-on-read techniques postpone modeling until query time, avoiding rigid relational constraints. The big data engineering services market, therefore, prioritizes streaming platforms that keep latency below 1 minute to minimize customer churn.
Cost-Efficient, Outcome-Based Service Contracts
Variable billing tied to queries processed or records scanned lets finance chiefs match spend with revenue. Service-level agreements now promise 99.9% pipeline uptime, shifting risk to vendors and spurring automation that curbs labor hours. Mid-market firms benefit most, gaining enterprise-grade data infrastructure without capital expenditure shocks. Penalties for missed performance targets heighten provider accountability, fostering the use of reusable accelerators over custom code. This commercial realignment expands the big data engineering services market beyond Global 2000 buyers.
Acute Shortage of Data-Engineering Talent
Demand exceeded supply three-to-one in 2025 as new tools outpaced university curricula. Senior engineers in Silicon Valley now command USD 250,000 packages. Offshore centers in India and Eastern Europe offer relief, yet coordination overhead dilutes savings. The gap fuels premium pricing for managed services, but it also slows internal projects, restraining the big data engineering services market in the near term.
Other drivers and restraints analyzed in the detailed report include:
- Cloud-Native Big-Data Stack Adoption
- Regulatory Push for Data-Driven Decision Making
- Cyber-Security and Privacy Compliance Costs
For complete list of drivers and restraints, kindly check the Table Of Contents.
Segment Analysis
Data Integration and ETL services captured 39.22% of the big data engineering services market share in 2025, making them the single largest revenue stream within the segment mix. Clients depend on these engagements to unify siloed ERP, CRM, and IoT data into lakehouse environments, ensuring schema consistency and reliable lineage. The big data engineering services market size tied to Integration and ETL remains resilient because schema drift and legacy system quirks continue to break pipelines, requiring constant refactoring. Meanwhile, Advanced Analytics and Visualization is projected to grow at a 15.91% CAGR through 2031 as enterprises move beyond descriptive insights to predictive and prescriptive models that recommend real-time actions.
Zero-ETL replication technologies that stream operational data directly into analytical stores are compressing latency, yet they shift transformation ownership to domain teams and heighten governance complexity. Vendors now bundle observability, cataloging, and lineage tracking with core ingestion work to safeguard metric consistency across business units. Automated data quality checks flag duplicate records or out-of-range sensor readings before they tarnish executive dashboards, reinforcing demand for integrated platforms. As a result, buyers increasingly favor single-vendor offerings that span ingestion to visualization, compressing procurement cycles and reducing vendor sprawl within the big data engineering services market.
Marketing and Sales accounted for 34.86% of the big data engineering services market in 2025 as firms raced to build customer data platforms that deliver millisecond-level personalization. These projects stitch together clickstream, call-center, and point-of-sale data so that recommendation engines can adapt website content on the fly. Real-time audience segmentation demands sub-second query performance, which drives heavy investment in in-memory feature stores and streaming orchestration. In parallel, Finance leverages streaming analytics for fraud detection and regulatory reporting, while Human Resources pilots attrition-prediction models, although privacy sensitivities in Europe slow the latter.
Operations and Supply-Chain workloads are set to expand at a 15.96% CAGR, positioning them as the fastest-rising business function through 2031. Predictive maintenance algorithms parse industrial IoT telemetry to forecast equipment failures days in advance, avoiding costly unplanned downtime. Retailers and manufacturers also integrate shipping manifests and GPS feeds to reroute inventory when ports clog or geopolitics shifts. Reverse ETL tools that send analytical outputs back into operational systems ensure frontline teams see propensity scores or risk alerts where they work, closing the action loop. This front-to-back integration elevates Operations from a cost center to a strategic growth lever, widening its role in the big data engineering services market.
Complete Report Scope:
- By Service Type
- Data Modelling and Architecture
- Data Integration and ETL
- Data Quality and Governance
- Advanced Analytics and Visualization
- By Business Function
- Marketing and Sales
- Finance
- Operations and Supply-Chain
- Human Resources
- By Organization Size
- Small and Medium Enterprises
- Large Enterprises
- By Deployment Mode
- Cloud
- On-Premises
- Hybrid
- By Geography
- North America
- United States
- Canada
- Mexico
- South America
- Brazil
- Argentina
- Rest of South America
- Europe
- United Kingdom
- Germany
- France
- Italy
- Rest of Europe
- Asia Pacific
- China
- Japan
- India
- South Korea
- Rest of Asia Pacific
- Middle East and Africa
- Middle East
- United Arab Emirates
- Saudi Arabia
- Rest of Middle East
- Africa
- South Africa
- Egypt
- Rest of Africa
- Middle East
- North America
Geography Analysis
North America contributed 42.38% of 2025 revenue thanks to dense hyperscaler footprints in low-cost power regions and a patchwork of state privacy statutes that necessitate fine-grained governance. Venture capital continues to finance open-source commercializations, feeding a pipeline of acquisition targets for global integrators. Canada grapples with cross-border data transfer assessments under PIPEDA, while Mexico's near-shoring boom boosts supply-chain telemetry projects.
Asia-Pacific is set to be the fastest-growing region, with a 16.14% CAGR. India's Digital India fund injects USD 1.2 billion into national data infrastructure, and China's provincial subsidies offset half of migration costs for state-owned manufacturers. Japan mandates digital twins across automotive plants by 2026, driving IoT integration work. South Korea extends subject rights to algorithmic transparency, increasing demand for explainable AI pipelines. Australia designates data centers as critical infrastructure, triggering managed security projects bundled with engineering services.
Europe remains governed by GDPR, which levied EUR 4.5 billion (USD 5.0 billion) in fines across 2024-2025, making lineage and consent management non-negotiable. Germany enforces on-premises rules for critical infrastructure, France funds a sovereign cloud, and the United Kingdom's post-Brexit adequacy is still provisional, adding uncertainty. South America starts with Brazil's LGPD, while Middle East sovereign funds finance hyperscale data centers as part of smart-city initiatives. Africa sees pilots in South Africa and Nigeria, though unreliable grids restrict broader adoption.
- Accenture plc
- International Business Machines Corporation
- Cognizant Technology Solutions Corporation
- Capgemini SE
- Infosys Limited
- Tata Consultancy Services Limited
- Wipro Limited
- Deloitte Touche Tohmatsu Limited
- Ernst and Young Global Limited
- KPMG International Limited
- Genpact Limited
- NTT Data Corporation
- L&T Technology Services Limited
- Hexaware Technologies Limited
- Mphasis Limited
- Tech Mahindra Limited
- Atos SE
- SAP SE
- Amazon Web Services, Inc.
- Microsoft Corporation
- Google LLC
- Snowflake Inc.
- Teradata Corporation
- Palantir Technologies Inc.
- Thoughtworks Holding, Inc.
- Slalom, LLC
Additional Benefits:
- The market estimate (ME) sheet in Excel format
- 3 months of analyst support
TABLE OF CONTENTS
1 INTRODUCTION
- 1.1 Study Assumptions and Market Definition
- 1.2 Scope of the Study
2 RESEARCH METHODOLOGY
3 EXECUTIVE SUMMARY
4 MARKET LANDSCAPE
- 4.1 Market Overview
- 4.2 Market Drivers
- 4.2.1 Proliferation of Unstructured IoT and Social Data
- 4.2.2 Cost-Efficient, Outcome-Based Service Contracts
- 4.2.3 Cloud-Native Big-Data Stack Adoption
- 4.2.4 Regulatory Push for Data-Driven Decision-Making
- 4.2.5 Rise of AI-Automated Data Pipelines
- 4.2.6 Industry-Specific Data Marketplaces
- 4.3 Market Restraints
- 4.3.1 Acute Shortage of Data-Engineering Talent
- 4.3.2 Cyber-Security and Privacy Compliance Costs
- 4.3.3 Legacy System Integration Complexity
- 4.3.4 Cloud-Egress and Vendor-Lock-In Economics
- 4.4 Industry Value Chain Analysis
- 4.5 Regulatory Landscape
- 4.6 Technological Outlook
- 4.7 Porter's Five Forces Analysis
- 4.7.1 Threat of New Entrants
- 4.7.2 Bargaining Power of Buyers
- 4.7.3 Bargaining Power of Suppliers
- 4.7.4 Threat of Substitutes
- 4.7.5 Competitive Rivalry
- 4.8 Impact of Macroeconomic Factors on the Market
- 4.9 Emerging Technology Trends
5 MARKET SIZE AND GROWTH FORECASTS (VALUE)
- 5.1 By Service Type
- 5.1.1 Data Modelling and Architecture
- 5.1.2 Data Integration and ETL
- 5.1.3 Data Quality and Governance
- 5.1.4 Advanced Analytics and Visualization
- 5.2 By Business Function
- 5.2.1 Marketing and Sales
- 5.2.2 Finance
- 5.2.3 Operations and Supply-Chain
- 5.2.4 Human Resources
- 5.3 By Organization Size
- 5.3.1 Small and Medium Enterprises
- 5.3.2 Large Enterprises
- 5.4 By Deployment Mode
- 5.4.1 Cloud
- 5.4.2 On-Premises
- 5.4.3 Hybrid
- 5.5 By Geography
- 5.5.1 North America
- 5.5.1.1 United States
- 5.5.1.2 Canada
- 5.5.1.3 Mexico
- 5.5.2 South America
- 5.5.2.1 Brazil
- 5.5.2.2 Argentina
- 5.5.2.3 Rest of South America
- 5.5.3 Europe
- 5.5.3.1 United Kingdom
- 5.5.3.2 Germany
- 5.5.3.3 France
- 5.5.3.4 Italy
- 5.5.3.5 Rest of Europe
- 5.5.4 Asia Pacific
- 5.5.4.1 China
- 5.5.4.2 Japan
- 5.5.4.3 India
- 5.5.4.4 South Korea
- 5.5.4.5 Rest of Asia Pacific
- 5.5.5 Middle East and Africa
- 5.5.5.1 Middle East
- 5.5.5.1.1 United Arab Emirates
- 5.5.5.1.2 Saudi Arabia
- 5.5.5.1.3 Rest of Middle East
- 5.5.5.2 Africa
- 5.5.5.2.1 South Africa
- 5.5.5.2.2 Egypt
- 5.5.5.2.3 Rest of Africa
- 5.5.5.1 Middle East
- 5.5.1 North America
6 COMPETITIVE LANDSCAPE
- 6.1 Market Concentration
- 6.2 Strategic Moves
- 6.3 Market Share Analysis
- 6.4 Company Profiles (includes Global Level Overview, Market Level Overview, Core Segments, Financials as available, Strategic Information, Market Rank/Share, Products and Services, Recent Developments)
- 6.4.1 Accenture plc
- 6.4.2 International Business Machines Corporation
- 6.4.3 Cognizant Technology Solutions Corporation
- 6.4.4 Capgemini SE
- 6.4.5 Infosys Limited
- 6.4.6 Tata Consultancy Services Limited
- 6.4.7 Wipro Limited
- 6.4.8 Deloitte Touche Tohmatsu Limited
- 6.4.9 Ernst and Young Global Limited
- 6.4.10 KPMG International Limited
- 6.4.11 Genpact Limited
- 6.4.12 NTT Data Corporation
- 6.4.13 L&T Technology Services Limited
- 6.4.14 Hexaware Technologies Limited
- 6.4.15 Mphasis Limited
- 6.4.16 Tech Mahindra Limited
- 6.4.17 Atos SE
- 6.4.18 SAP SE
- 6.4.19 Amazon Web Services, Inc.
- 6.4.20 Microsoft Corporation
- 6.4.21 Google LLC
- 6.4.22 Snowflake Inc.
- 6.4.23 Teradata Corporation
- 6.4.24 Palantir Technologies Inc.
- 6.4.25 Thoughtworks Holding, Inc.
- 6.4.26 Slalom, LLC
7 MARKET OPPORTUNITIES AND FUTURE OUTLOOK
- 7.1 White-Space and Unmet-Need Assessment

