PUBLISHER: Mordor Intelligence | PRODUCT CODE: 2124542

PUBLISHER: Mordor Intelligence | PRODUCT CODE: 2124542
Fire Suppression Systems - Market Share Analysis, Industry Trends & Statistics, Growth Forecasts (2026 - 2031)
According to Mordor Intelligence, the fire suppression systems market size was valued at USD 22.61 billion in 2025 and estimated to grow from USD 23.71 billion in 2026 to reach USD 30.02 billion by 2031, at a CAGR of 4.85% during the forecast period (2026-2031).
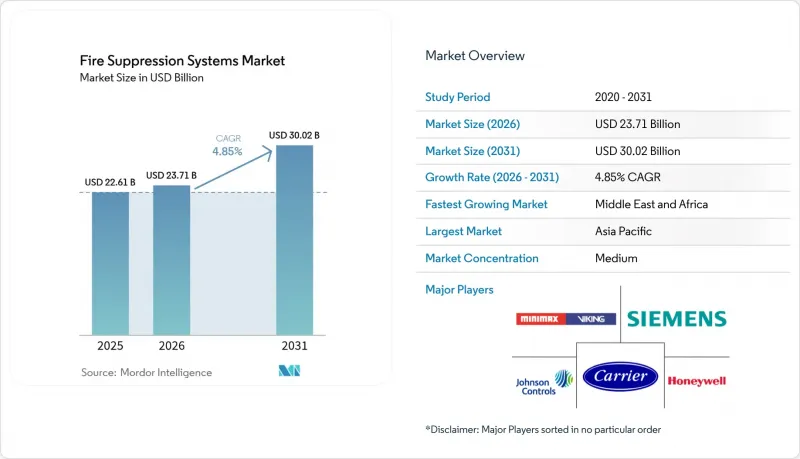
This report is Segmented by Agent Type (Water-Based, Clean-Agent, Foam-Based Systems, Dry-Chemical Powder, and More), Configuration (Fixed, Portable), End-Use (Commercial, Industrial, Residential, Transportation, , and More), Installation (New Installations, Retrofit), Distribution (Direct, Integrators, OEM), and Geography. Market Forecasts are in Value (USD).
Global Fire Suppression Systems Market Trends and Insights
Transition from Halon to Sustainable Clean-Agent Replacements
EASA's requirement for halon-free aircraft fire protection by 2026 forces airlines and MROs to retrofit nearly 15,000 aircraft, creating a USD 800 million annual opportunity for Novec 1230, FM-200, and inert-gas systems. Demand concentrates in hangars, telecom hubs, and mission-critical facilities where environmental compliance outweighs life-cycle cost, favoring integrators with multi-agent design expertise.
Insurance Premium Discounts for Automated Suppression in High-Value Assets
Commercial property insurers grant 5-15% policy discounts for NFPA-compliant automatic systems, a benefit magnified by U.S. tax code Section 179 that allows immediate expensing of up to USD 1.22 million for sprinkler installations. The combined savings reduce payback periods to three years for many data centers and pharma plants.
PFAS Ban Driving Costly AFFF Foam Retrofits
The EU's impending PFAS prohibition forces airports and petro-chemical depots to swap AFFF for fluorine-free formulations that require 30-50% higher application rates, raising per-site retrofit costs to USD 150,000-500,000.
Other drivers and restraints analyzed in the detailed report include:
- Data-Center Boom Spurring Water-less Gaseous Systems
- Offshore Oil-and-Gas Fire-Safety Mandates
- Scarcity of NFPA-Certified Installers in Emerging Asia
For complete list of drivers and restraints, kindly check the Table Of Contents.
Segment Analysis
Water-based sprinklers retained a 46.35% fire suppression systems market share in 2025, buoyed by low cost and proven performance. Clean-agent solutions, although smaller in absolute value, are slated for a 6.95% CAGR, lifting their fire suppression systems market size measurably during 2026-2031. Regulatory pressure to replace halon and PFAS foams accelerates adoption of Novec 1230, FM-200, and IG-541.
Technology convergence is spawning hybrid arrangements that pair water mist with inert gas to tame lithium-ion thermal runaway. UL 9540A trials show water overlays can halt cascading cell failures faster than gas-only discharges. Foam lines, challenged by fluorine-free transition costs, risk incremental share loss, whereas CO2 and powder systems cling to niche roles in unoccupied or battery-assembly zones.
Fixed installations accounted for 81.20% of the 2025 fire suppression systems market, reflecting end-users' preference for always-on protection in data centers, refineries, and commercial towers. Portables, although smaller, are gaining at 5.85% CAGR as construction sites and events need flexible cover.
High-bay warehouses and cold-storage facilities are adopting Johnson Controls' Tyco ESFR-25 dry-type sprinkler, which functions at -60 °F and eliminates in-rack heads. IoT-enabled monitors now extend to portables, giving facility managers real-time visibility similar to fixed networks.
Complete Report Scope:
- By Suppression Agent Type
- Water-based Systems (Sprinkler, Mist)
- Clean-Agent (FM-200, Novec 1230, Inert Gas)
- Foam-based Systems (AFFF, Fluorine-free)
- Dry-Chemical Powder Systems
- Carbon-Dioxide Systems
- Hybrid Inert-Gas and Water-Mist Systems
- By Product Configuration
- Fixed/Installed Systems
- Portable and Mobile Units
- By End-Use Industry
- Commercial (Offices, Retail, Hospitality)
- Industrial (Oil and Gas, Energy, Manufacturing, Warehouses)
- Residential (Multi- and Single-Family)
- Transportation (Marine, Aviation, Rail, Automotive)
- Public and Institutional (Education, Healthcare, Government)
- By Installation Type
- New Installations
- Retrofit and Replacement
- By Distribution Channel
- Direct to End-User
- System Integrators and EPC Contractors
- OEM/Equipment Manufacturers
- By Geography
- North America
- United States
- Canada
- Mexico
- South America
- Brazil
- Argentina
- Rest of South America
- Europe
- Germany
- United Kingdom
- France
- Italy
- Spain
- Rest of Europe
- Asia-Pacific
- China
- India
- Japan
- South Korea
- ASEAN
- Australia
- Rest of Asia-Pacific
- Middle East and Africa
- Saudi Arabia
- South Africa
- Nigeria
- United Arab Emirates
- Rest of Middle East and Africa
- North America
Geography Analysis
Asia-Pacific produced 35.65% of global revenue in 2025 as China, India, and Southeast Asia commissioned hyperscale data centers and megaproject factories. Government incentives and an average USD 2 trillion in annual construction spending ensure the region remains the epicenter of the fire suppression systems market. NFPA-certified labor shortages continue to stretch project timelines and raise installed costs, yet domestic codes are gradually harmonizing with U.S. and EU standards to open cross-border supply chains.
North America enjoys deep installer pools and mature building codes, translating into predictable retrofit volumes tied to insurance incentives. The 2025 NFPA 13 update is expected to inject a new wave of demand across legacy warehouses and healthcare facilities. Component shortages, especially in electronic control panels, have introduced 3-6-month delays, but value-chain resiliency programs underway at leading OEMs should ease the bottleneck during 2026.
Europe records steady uptake as the PFAS foam ban and post-Grenfell rules reshape specifications. Germany's advanced manufacturing plants demand inert-gas and water-mist hybrids that command premium pricing. Offshore wind farms in the North Sea are another rising niche, requiring marine-grade suppression assemblies. Brexit-related customs frictions persist, yet collaborative agreements with EU-based distributors are smoothing flows of cylinders and valves.
- Johnson Controls International plc
- Siemens AG
- Carrier Global Corp. (Kidde)
- Honeywell International Inc.
- Minimax Viking Group
- Fike Corporation
- Consilium AB
- ORR Protection Systems
- Halma plc (Firetrace International)
- NAFFCO FZE
- Securiton AG
- Victaulic Company
- Rotarex SA
- Danfoss Fire Safety A/S
- Fireaway Inc. (Stat-X)
- Hochiki Corporation
- McWane Inc.
- Viking Group Inc.
- Marioff Corporation Oy
- SEVO Systems Inc.
Additional Benefits:
- The market estimate (ME) sheet in Excel format
- 3 months of analyst support
TABLE OF CONTENTS
1 INTRODUCTION
- 1.1 Study Assumptions and Market Definition
- 1.2 Scope of the Study
2 RESEARCH METHODOLOGY
3 EXECUTIVE SUMMARY
4 MARKET LANDSCAPE
- 4.1 Market Overview
- 4.2 Market Drivers
- 4.2.1 Transition from Halon to Sustainable Clean-Agent Replacements (Europe)
- 4.2.2 Insurance Premium Discounts for Automated Suppression in High-Value Assets (North America)
- 4.2.3 Data-center Boom Spurring Water-less Gaseous Systems (Asia)
- 4.2.4 Offshore Oil-and-Gas Fire-safety Mandates (IMO 2020 North Sea and GCC)
- 4.2.5 Post-Grenfell Residential High-Rise Sprinkler Mandates (US and UK)
- 4.2.6 EV-Battery Production Lines Requiring Dry-Chemical Suppression (Global)
- 4.3 Market Restraints
- 4.3.1 PFAS Ban Driving Costly AFFF Foam Retrofits
- 4.3.2 Scarcity of NFPA-Certified Installers in Emerging Asia
- 4.3.3 Semiconductor Component Shortages Delaying Projects
- 4.3.4 High CAPEX of Inert-Gas Systems for Small Premises
- 4.4 Supply Chain Analysis
- 4.5 Regulatory Outlook
- 4.6 Technological Outlook
- 4.7 Porter's Five Forces Analysis
- 4.7.1 Bargaining Power of Suppliers
- 4.7.2 Bargaining Power of Buyers
- 4.7.3 Threat of New Entrants
- 4.7.4 Threat of Substitutes
- 4.7.5 Intensity of Competitive Rivalry
5 MARKET SIZE AND GROWTH FORECASTS (VALUE)
- 5.1 By Suppression Agent Type
- 5.1.1 Water-based Systems (Sprinkler, Mist)
- 5.1.2 Clean-Agent (FM-200, Novec 1230, Inert Gas)
- 5.1.3 Foam-based Systems (AFFF, Fluorine-free)
- 5.1.4 Dry-Chemical Powder Systems
- 5.1.5 Carbon-Dioxide Systems
- 5.1.6 Hybrid Inert-Gas and Water-Mist Systems
- 5.2 By Product Configuration
- 5.2.1 Fixed/Installed Systems
- 5.2.2 Portable and Mobile Units
- 5.3 By End-Use Industry
- 5.3.1 Commercial (Offices, Retail, Hospitality)
- 5.3.2 Industrial (Oil and Gas, Energy, Manufacturing, Warehouses)
- 5.3.3 Residential (Multi- and Single-Family)
- 5.3.4 Transportation (Marine, Aviation, Rail, Automotive)
- 5.3.5 Public and Institutional (Education, Healthcare, Government)
- 5.4 By Installation Type
- 5.4.1 New Installations
- 5.4.2 Retrofit and Replacement
- 5.5 By Distribution Channel
- 5.5.1 Direct to End-User
- 5.5.2 System Integrators and EPC Contractors
- 5.5.3 OEM/Equipment Manufacturers
- 5.6 By Geography
- 5.6.1 North America
- 5.6.1.1 United States
- 5.6.1.2 Canada
- 5.6.1.3 Mexico
- 5.6.2 South America
- 5.6.2.1 Brazil
- 5.6.2.2 Argentina
- 5.6.2.3 Rest of South America
- 5.6.3 Europe
- 5.6.3.1 Germany
- 5.6.3.2 United Kingdom
- 5.6.3.3 France
- 5.6.3.4 Italy
- 5.6.3.5 Spain
- 5.6.3.6 Rest of Europe
- 5.6.4 Asia-Pacific
- 5.6.4.1 China
- 5.6.4.2 India
- 5.6.4.3 Japan
- 5.6.4.4 South Korea
- 5.6.4.5 ASEAN
- 5.6.4.6 Australia
- 5.6.4.7 Rest of Asia-Pacific
- 5.6.5 Middle East and Africa
- 5.6.5.1 Saudi Arabia
- 5.6.5.2 South Africa
- 5.6.5.3 Nigeria
- 5.6.5.4 United Arab Emirates
- 5.6.5.5 Rest of Middle East and Africa
- 5.6.1 North America
6 COMPETITIVE LANDSCAPE
- 6.1 Market Concentration
- 6.2 Strategic Moves
- 6.3 Market Share Analysis
- 6.4 Company Profiles
- 6.4.1 Johnson Controls International plc
- 6.4.2 Siemens AG
- 6.4.3 Carrier Global Corp. (Kidde)
- 6.4.4 Honeywell International Inc.
- 6.4.5 Minimax Viking Group
- 6.4.6 Fike Corporation
- 6.4.7 Consilium AB
- 6.4.8 ORR Protection Systems
- 6.4.9 Halma plc (Firetrace International)
- 6.4.10 NAFFCO FZE
- 6.4.11 Securiton AG
- 6.4.12 Victaulic Company
- 6.4.13 Rotarex SA
- 6.4.14 Danfoss Fire Safety A/S
- 6.4.15 Fireaway Inc. (Stat-X)
- 6.4.16 Hochiki Corporation
- 6.4.17 McWane Inc.
- 6.4.18 Viking Group Inc.
- 6.4.19 Marioff Corporation Oy
- 6.4.20 SEVO Systems Inc.
7 MARKET OPPORTUNITIES AND FUTURE OUTLOOK
- 7.1 White-space and Unmet-need Assessment

