PUBLISHER: Mordor Intelligence | PRODUCT CODE: 2124628

PUBLISHER: Mordor Intelligence | PRODUCT CODE: 2124628
5G IoT - Market Share Analysis, Industry Trends & Statistics, Growth Forecasts (2026 - 2031)
According to Mordor Intelligence, the 5G IoT market size was valued at USD 35.80 billion in 2025 and estimated to grow from USD 45.45 billion in 2026 to reach USD 149.83 billion by 2031, at a CAGR of 26.94% during the forecast period (2026-2031).
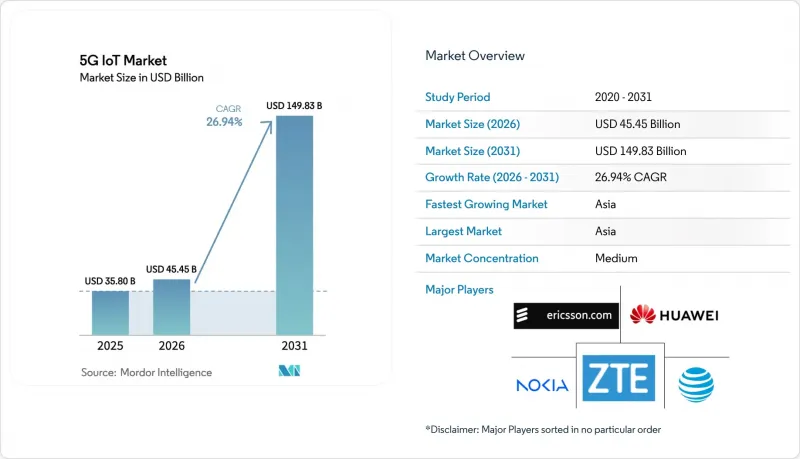
This report is Segmented by Technology (Ultra-Reliable Low-Latency Communications (URLLC), Low-Power Wide-Area Network (LPWAN)), End-User Industry (Manufacturing, Supply Chain and Logistics, Healthcare, Retail, Smart Cities and Infrastructure, Automotive and Transportation), and Geography
Global 5G IoT Market Trends and Insights
Massive device-density enablement after RedCap roll-out
Release 17 RedCap limits peak data rates to 250 Mbps and employs simpler antenna architectures, trimming module costs by 30-40%. Multi-year battery life aligns with industrial automation, smart metering, and city-wide sensing, while backward compatibility maintains nationwide coverage.
Telco cloud & network-API monetization playbooks
Cloud-native 5G cores let operators expose quality-of-service, location, and slicing functions through APIs. Enterprises pay a premium for deterministic performance, creating service revenue that offsets heavy spectrum and infrastructure investments.
4G/LPWAN sufficiency for sub-USD 2 device classes
Many low-value sensors only transmit kilobytes per day; LTE Cat-1 and NB-IoT already meet such needs at half the module cost. Rural utilities and agri-tech firms therefore defer 5G upgrades until pricing aligns with value delivered.
Other drivers and restraints analyzed in the detailed report include:
- 3GPP-approved reduced-capability chipsets below USD 5
- Energy-price-linked demand for ultra-low-power modules
- Security-compliance costs (NIS2, SBOM) squeeze OEM margins
For complete list of drivers and restraints, kindly check the Table Of Contents.
Segment Analysis
LPWAN (5G RedCap) captured 53.00% of the 5G market in 2025, reflecting optimum trade-offs between cost and network capabilities. URLLC, although smaller, is projected to grow at a 40.63% CAGR as factories and autonomous vehicles demand sub-1 ms latency. The 5G Internet of Things market size for LPWAN devices is projected to rise significantly as module prices fall toward USD 4 by 2027. Enterprises migrate asset-tracking and environmental-monitoring workloads from LTE Cat-1 to RedCap to leverage network slicing without incurring full 5G hardware costs. Conversely, domains such as robotic welding and remote surgery justify the premium of URLLC, driving specialized chipset innovation.
URLLC use cases frequently pair with edge-compute nodes inside private 5G networks, replacing deterministic wired Ethernet. Audi's implementation in press-shops improved cycle times and reduced downtime, validating the business case. Component vendors compete on time-sensitive networking features and FEC schemes that guarantee packet delivery, distinguishing offers beyond bandwidth metrics. In sum, technology choice in the 5G Internet of Things market aligns with distinct latency, power, and cost envelopes instead of a one-size-fits-all roadmap.
Complete Report Scope:
- By Technology
- Ultra-Reliable Low-Latency Communications (URLLC)
- Low-Power Wide-Area Network (LPWAN 5G RedCap/NB)
- By End-User Industry
- Manufacturing
- Supply-Chain and Logistics
- Healthcare
- Retail
- Smart Cities and Infrastructure
- Automotive and Transportation
- By Geography
- North America
- United States
- Canada
- Mexico
- South America
- Brazil
- Argentina
- Europe
- Germany
- United Kingdom
- France
- Spain
- Russia
- Asia-Pacific
- China
- Japan
- India
- Australia and New Zealand
- Middle East and Africa
- Middle East
- Africa
- North America
Geography Analysis
Asia-Pacific dominated the 5G Internet of Things market with China accounting for 41.25% of revenue in 2025, backed by operator capex and policy incentives. China Unicom plans 5G-Advanced coverage in 300 cities by end-2025, adding massive machine-type capacity and raising network utilization. Local integrators retrofit production lines in steel, textiles, and electronics, mainstreaming private-network know-how. India posts the fastest regional CAGR at 34.95% through 2031 as RedCap's sub-USD 5 modules fit the budget of small and medium enterprises. Government programs such as Digital India and Make-in-India relax spectrum-leasing rules, accelerating campus-wide deployments in pharma, auto, and energy verticals.
North America prioritizes private-network pilots in semiconductor fabs and defense hubs, aided by CHIPS Act grants. The automotive corridor from Michigan to Texas deploys roadside V2X units and factory URLLC links, validating return-on-investment for high-bandwidth, low-latency services. Cloud hyperscalers partner with carriers to expose network APIs that let enterprises configure paths with code, shortening service-activation cycles from months to minutes. This platform's dynamic extends the 5G Internet of Things market beyond connectivity into application hosting.
- Nokia
- Ericsson
- Huawei
- ZTE
- Cisco
- Qualcomm
- ATandT
- Verizon
- Deutsche Telekom
- Vodafone
- China Mobile
- SK Telecom
- KT Corp
- Telefonica
- Telstra
- Rogers
- Orange
- Bell Canada
- NTT DOCOMO
- Reliance Jio
Additional Benefits:
- The market estimate (ME) sheet in Excel format
- 3 months of analyst support
TABLE OF CONTENTS
1 INTRODUCTION
- 1.1 Study Assumptions and Market Definition
- 1.2 Scope of the Study
2 RESEARCH METHODOLOGY
3 EXECUTIVE SUMMARY
4 MARKET LANDSCAPE
- 4.1 Market Overview
- 4.2 Market Drivers
- 4.2.1 Massive device-density enablement after RedCap roll-out
- 4.2.2 Telco cloud and network-API monetisation playbooks
- 4.2.3 3GPP-approved reduced-capability (NR-Light) chipsets below US$5
- 4.2.4 Energy-price-linked demand for ultra-low-power modules
- 4.2.5 Supply-chain pressure to digitise asset-tracking post EU CSRD
- 4.2.6 Government-subsidised 5G private-network grants (US CHIPS, EU IPCEI)
- 4.3 Market Restraints
- 4.3.1 4G/LPWAN sufficiency for sub-US$2 device classes
- 4.3.2 High mmWave module BOM (>US$60) for industrial cameras
- 4.3.3 Fragmented certification regimes for RedCap in LATAM and Africa
- 4.3.4 Security-compliance costs (NIS2, SBOM) squeeze OEM margins
- 4.4 Value/Supply-Chain Analysis
- 4.5 Regulatory Landscape
- 4.6 Technological Outlook
- 4.7 Porter's Five Forces
- 4.7.1 Threat of New Entrants
- 4.7.2 Bargaining Power of Suppliers
- 4.7.3 Bargaining Power of Buyers
- 4.7.4 Threat of Substitutes
- 4.7.5 Intensity of Competitive Rivalry
5 MARKET SIZE AND GROWTH FORECASTS (VALUE)
- 5.1 By Technology
- 5.1.1 Ultra-Reliable Low-Latency Communications (URLLC)
- 5.1.2 Low-Power Wide-Area Network (LPWAN 5G RedCap/NB)
- 5.2 By End-User Industry
- 5.2.1 Manufacturing
- 5.2.2 Supply-Chain and Logistics
- 5.2.3 Healthcare
- 5.2.4 Retail
- 5.2.5 Smart Cities and Infrastructure
- 5.2.6 Automotive and Transportation
- 5.3 By Geography
- 5.3.1 North America
- 5.3.1.1 United States
- 5.3.1.2 Canada
- 5.3.1.3 Mexico
- 5.3.2 South America
- 5.3.2.1 Brazil
- 5.3.2.2 Argentina
- 5.3.3 Europe
- 5.3.3.1 Germany
- 5.3.3.2 United Kingdom
- 5.3.3.3 France
- 5.3.3.4 Spain
- 5.3.3.5 Russia
- 5.3.4 Asia-Pacific
- 5.3.4.1 China
- 5.3.4.2 Japan
- 5.3.4.3 India
- 5.3.4.4 Australia and New Zealand
- 5.3.5 Middle East and Africa
- 5.3.5.1 Middle East
- 5.3.5.2 Africa
- 5.3.1 North America
6 COMPETITIVE LANDSCAPE
- 6.1 Market Concentration
- 6.2 Strategic Moves
- 6.3 Market Share Analysis
- 6.4 Company Profiles (includes Global level Overview, Recent Developments)
- 6.4.1 Nokia
- 6.4.2 Ericsson
- 6.4.3 Huawei
- 6.4.4 ZTE
- 6.4.5 Cisco
- 6.4.6 Qualcomm
- 6.4.7 ATandT
- 6.4.8 Verizon
- 6.4.9 Deutsche Telekom
- 6.4.10 Vodafone
- 6.4.11 China Mobile
- 6.4.12 SK Telecom
- 6.4.13 KT Corp
- 6.4.14 Telefonica
- 6.4.15 Telstra
- 6.4.16 Rogers
- 6.4.17 Orange
- 6.4.18 Bell Canada
- 6.4.19 NTT DOCOMO
- 6.4.20 Reliance Jio
7 MARKET OPPORTUNITIES AND FUTURE OUTLOOK
- 7.1 White-space and Unmet-need Assessment

