PUBLISHER: Mordor Intelligence | PRODUCT CODE: 2124789

PUBLISHER: Mordor Intelligence | PRODUCT CODE: 2124789
Global Continuous Bioprocessing - Market Share Analysis, Industry Trends & Statistics, Growth Forecasts (2026 - 2031)
According to Mordor Intelligence, continuous bioprocessing market size in 2026 is estimated at USD 305.13 million, growing from 2025 value of USD 248.77 million with 2031 projections showing USD 846.98 million, growing at 22.65% CAGR over 2026-2031.
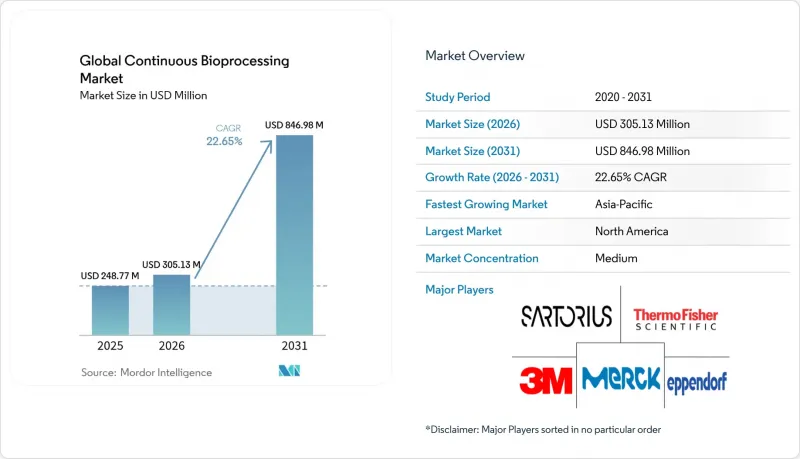
This report Segments by Workflow (Upstream Continuous Bioprocessing and Downstream Continuous Bioprocessing), by Product (Continuous Bioreactors and More), by Application (Monoclonal Antibodies, and More), by End User (Pharmaceutical and Biotechnology Companies and More), and Geography (North America, and More). The Market Forecasts are Provided in Terms of Value (USD).
Global Continuous Bioprocessing Market Trends and Insights
Rising Demand for Biologics & Biosimilars
More than 1,200 cell and gene therapy trials were active in 2024 versus just 37 US-approved products, underscoring a supply-demand gap that continuous platforms can close by elevating volumetric productivity and enabling rapid line changeovers. Samsung Biologics won contracts worth over USD 3.3 billion in 2024 and scaled to 784,000 L capacity using continuous technology, illustrating how large-volume biologics producers are embracing intensive, steady-state operations. Biosimilar developers likewise pursue continuous bioprocessing to contain costs amid aggressive price competition, especially in Europe. The modality's steady output and smaller footprint alleviate capacity bottlenecks that have historically delayed market entry for high-demand therapies. Collectively, these trends push the continuous bioprocessing market toward mainstream adoption in both pioneer and fast-follower regions.
Need to Reduce Manufacturing Cost & Footprint
Digital process design and intensified continuous operations can trim biomanufacturing costs by up to 70%, translating to USD 1.25 billion annual savings for a typical blockbuster biologic. Government support mirrors industry priorities: China earmarked USD 4.17 billion for new biomanufacturing capacity in 2024, with policymakers citing the strategic importance of cost-competitive biologics production Continuous bioprocessing eliminates the need for several large-scale stainless-steel units, enabling smaller, modular facilities that reduce capital intensity and operating overhead. Higher titer outputs shorten downstream campaigns, cut buffer volumes and reduce energy demands, further lowering cost-per-gram benchmarks. These structural savings position the continuous bioprocessing market as a preferred route for greenfield plants in both developed and emerging economies.
High Upfront CAPEX & Retrofitting Challenges
Converting a legacy batch plant to continuous can cost 50-70% more than greenfield builds because utilities, clean-room layouts and validation protocols must be overhauled. Smaller biotech firms face liquidity constraints, delaying investment despite medium-term paybacks of 3-5 years. Suppliers now offer equipment-as-a-service and lease-to-own agreements to spread cash requirements, but balance-sheet impact still slows uptake in price-sensitive regions. Capital risk is amplified by immature second-hand markets for continuous gear, limiting fallback options if pipelines shift. Consequently, CAPEX intensity remains a notable drag on the continuous bioprocessing market's near-term penetration outside top-tier sponsors.
Other drivers and restraints analyzed in the detailed report include:
- Accelerated Product Changeover & Flexibility
- Regulatory Encouragement for Continuous Manufacturing
- Limited Proven Downstream Continuous Solutions
For complete list of drivers and restraints, kindly check the Table Of Contents.
Segment Analysis
Upstream continuous bioprocessing held 56.02% of continuous bioprocessing market share in 2025, thanks to high-cell-density perfusion and intensified seed trains that raise titers three- to five-fold over fed-batch alternatives. This leadership translates into larger installed perfusion bioreactor fleets, robust supply chains for single-use consumables and accumulated know-how that lowers technical barriers for new entrants. Downstream still represents a smaller slice of continuous bioprocessing market size but is forecast to grow at 24.01% CAGR to 2031 as chromatography skid vendors standardize multicolumn systems and continuous ultrafiltration deployments expand.
Innovations such as high-density cell banking enable direct inoculation into production vessels, cutting overall production timelines by four to five days and aligning well with tight clinical supply windows bioprocessintl.com. Simultaneously, advanced PAT sensors embedded in upstream lines deliver real-time metabolite data that feed AI-driven controllers for on-the-fly parameter adjustments. Collectively, these refinements reinforce the upstream segment's pivotal role in guiding end-to-end continuous adoption, cementing its contribution to continuous bioprocessing market momentum across monoclonal antibody, vaccine and emerging cell therapy workflows.
Bioreactors constituted 60.74% of continuous bioprocessing market size in 2025, confirming their status as the central integration node for upstream intensification. The footprint includes alternating-tangential-flow perfusion devices and vertical-wheel impeller designs that support sensitive cells at scale. Tangential-flow filtration modules follow as the fastest-growing product line, advancing at 24.31% CAGR through 2031 as end-users seek closed, steady-state clarification and concentration solutions.
Emerging designs allow 1 L to 5,000 L scalability with consistent shear profiles, simplifying tech transfer from process development to GMP suites pbsbiotech.com. Continuous chromatographic skids now integrate UV, conductivity and pool-volume feedback to ensure column loading consistency, while single-use flow-paths curb cross-contamination risk and eliminate costly cleaning cycles. Collectively, these product innovations fortify supplier ecosystems and expand addressable applications, deepening the installed base that sustains the continuous bioprocessing market.
Complete Report Scope:
- By Workflow
- Upstream Continuous Bioprocessing
- Downstream Continuous Bioprocessing
- By Product
- Continuous Bioreactors
- Tangential Flow Filtration (TFF) Systems
- Continuous Chromatography Systems
- Consumables & Single-Use Components
- Process Control & Monitoring Software
- By Application
- Monoclonal Antibodies
- Vaccines
- Cell & Gene Therapies
- Recombinant Proteins
- Others (Biosimilars, Blood Factors)
- By Scale
- Pre-clinical & Pilot Scale
- Clinical Scale
- Commercial Scale
- By End User
- Biopharmaceutical & Biotechnology Companies
- Contract Manufacturing & Development Organizations (CMOs/CDMOs)
- Academic & Research Institutes
- By Region
- North America
- United States
- Canada
- Mexico
- Europe
- South America
- Germany
- Italy
- Spain
- Russia
- Rest of Europe
- Asia-Pacific
- China
- Japan
- India
- South Korea
- Australia
- Rest of Asia-Pacific
- South America
- Brazil
- Argentina
- Rest of South America
- Middle East and Africa
- GCC
- South Africa
- Rest of Middle East and Africa
- North America
Geography Analysis
North America led with 42.28% revenue share in 2025, underpinned by mature biomanufacturing hubs, supportive regulatory frameworks and a robust venture-capital environment. Fujifilm committed USD 1.2 billion to expand capacity in North Carolina, while Lonza acquired Genentech's 330,000-L Vacaville plant for USD 1.2 billion, reinforcing the region's long-term capacity outlook. The cluster's academic-industry consortia foster rapid scale-up of emerging modalities such as allogeneic CAR-T cells, cementing the region's leadership in high-complexity therapeutics.
Asia-Pacific is the fastest-growing region, forecast at 24.86% CAGR, driven by China's USD 4.17 billion biomanufacturing stimulus and South Korea's parallel capacity surge, where Lotte Biologics is building a USD 3.3 billion site pharmamanufacturing.com. Cost-competitive labor, streamlined regulatory reforms and government tax incentives lure multinational sponsors to locate new continuous lines in the region. Local biotech champions likewise adopt continuous workflows to compete on quality and speed with Western peers, pushing supply-chain localization for single-use consumables and advanced sensors.
Europe maintains steady expansion as sustainability mandates align with continuous processing advantages. Adoption accelerates further once the EU Biotech Act takes effect in 2026, harmonizing standards for real-time release and digital records. European vendors lead innovation in multicolumn chromatography, closing the downstream gap and positioning the bloc as a competence hub for continuous purification technologies. Collectively, regional dynamics ensure that the continuous bioprocessing market evolves across multiple centers of excellence, reducing systemic risk and fostering healthy competitive tension.
- Sartorius
- Thermo Fisher Scientific
- Danaher Corporation (Cytiva & Pall)
- Merck KGaA (MilliporeSigma)
- 3M
- Repligen
- Eppendorf
- Getinge AB (Applikon)
- ABEC
- Novasep Holding SAS
- Entegris Inc.
- Asahi Kasei
- Meissner Filtration Products
- PBS Biotech Inc.
- Lonza Group
- AGC Biologics
- Samsung Group
- Wuxi Biologics
- ThermoGenesis Holdings Inc.
- Kuhner Shaker AG
Additional Benefits:
- The market estimate (ME) sheet in Excel format
- 3 months of analyst support
TABLE OF CONTENTS
1 Introduction
- 1.1 Study Assumptions & Market Definition
- 1.2 Scope of the Study
2 Research Methodology
3 Executive Summary
4 Market Landscape
- 4.1 Market Overview
- 4.2 Market Drivers
- 4.2.1 Rising demand for biologics & biosimilars
- 4.2.2 Need to reduce manufacturing cost & footprint
- 4.2.3 Accelerated product changeover & flexibility
- 4.2.4 Regulatory encouragement for continuous manufacturing
- 4.2.5 Integration of PAT with AI-driven real-time release analytics
- 4.2.6 Adoption of perfusion-compatible single-use sensors in emerging markets
- 4.3 Market Restraints
- 4.3.1 High upfront CAPEX & retrofitting challenges
- 4.3.2 Limited proven downstream continuous solutions
- 4.3.3 Regulatory validation complexities for multi-product facilities
- 4.3.4 Scarcity of skilled workforce for hybrid control architectures
- 4.4 Value / Supply-Chain Analysis
- 4.5 Regulatory Landscape
- 4.6 Technological Outlook
- 4.7 Porter's Five Forces
- 4.7.1 Threat of New Entrants
- 4.7.2 Bargaining Power of Suppliers
- 4.7.3 Bargaining Power of Buyers
- 4.7.4 Threat of Substitutes
- 4.7.5 Competitive Rivalry
5 Market Size & Growth Forecasts (Value, 2024-2030)
- 5.1 By Workflow
- 5.1.1 Upstream Continuous Bioprocessing
- 5.1.2 Downstream Continuous Bioprocessing
- 5.2 By Product
- 5.2.1 Continuous Bioreactors
- 5.2.2 Tangential Flow Filtration (TFF) Systems
- 5.2.3 Continuous Chromatography Systems
- 5.2.4 Consumables & Single-Use Components
- 5.2.5 Process Control & Monitoring Software
- 5.3 By Application
- 5.3.1 Monoclonal Antibodies
- 5.3.2 Vaccines
- 5.3.3 Cell & Gene Therapies
- 5.3.4 Recombinant Proteins
- 5.3.5 Others (Biosimilars, Blood Factors)
- 5.4 By Scale
- 5.4.1 Pre-clinical & Pilot Scale
- 5.4.2 Clinical Scale
- 5.4.3 Commercial Scale
- 5.5 By End User
- 5.5.1 Biopharmaceutical & Biotechnology Companies
- 5.5.2 Contract Manufacturing & Development Organizations (CMOs/CDMOs)
- 5.5.3 Academic & Research Institutes
- 5.6 By Region
- 5.6.1 North America
- 5.6.1.1 United States
- 5.6.1.2 Canada
- 5.6.1.3 Mexico
- 5.6.2 Europe
- 5.6.2.1 South America
- 5.6.2.2 Germany
- 5.6.2.3 Italy
- 5.6.2.4 Spain
- 5.6.2.5 Russia
- 5.6.2.6 Rest of Europe
- 5.6.3 Asia-Pacific
- 5.6.3.1 China
- 5.6.3.2 Japan
- 5.6.3.3 India
- 5.6.3.4 South Korea
- 5.6.3.5 Australia
- 5.6.3.6 Rest of Asia-Pacific
- 5.6.4 South America
- 5.6.4.1 Brazil
- 5.6.4.2 Argentina
- 5.6.4.3 Rest of South America
- 5.6.5 Middle East and Africa
- 5.6.5.1 GCC
- 5.6.5.2 South Africa
- 5.6.5.3 Rest of Middle East and Africa
- 5.6.1 North America
6 Competitive Landscape
- 6.1 Market Concentration
- 6.2 Market Share Analysis
- 6.3 Company Profiles {(includes Global level Overview, Market level overview, Core Segments, Financials as available, Strategic Information, Market Rank/Share for key companies, Products & Services, and Recent Developments)}
- 6.3.1 Sartorius AG
- 6.3.2 Thermo Fisher Scientific Inc.
- 6.3.3 Danaher Corporation (Cytiva & Pall)
- 6.3.4 Merck KGaA (MilliporeSigma)
- 6.3.5 3M Company
- 6.3.6 Repligen Corporation
- 6.3.7 Eppendorf SE
- 6.3.8 Getinge AB (Applikon)
- 6.3.9 ABEC Inc.
- 6.3.10 Novasep Holding SAS
- 6.3.11 Entegris Inc.
- 6.3.12 Asahi Kasei Corporation
- 6.3.13 Meissner Filtration Products Inc.
- 6.3.14 PBS Biotech Inc.
- 6.3.15 Lonza Group AG
- 6.3.16 AGC Biologics
- 6.3.17 Samsung Biologics
- 6.3.18 Wuxi Biologics
- 6.3.19 ThermoGenesis Holdings Inc.
- 6.3.20 Kuhner Shaker AG
7 Market Opportunities & Future Outlook
- 7.1 White-space & Unmet-Need Assessment

