PUBLISHER: Mordor Intelligence | PRODUCT CODE: 2124947

PUBLISHER: Mordor Intelligence | PRODUCT CODE: 2124947
Retail Digital Signage - Market Share Analysis, Industry Trends & Statistics, Growth Forecasts (2026 - 2031)
According to Mordor Intelligence, the retail digital signage market size in 2026 is estimated at USD 6.24 billion, growing from 2025 value of USD 5.89 billion with 2031 projections showing USD 8.29 billion, growing at 5.86% CAGR over 2026-2031.
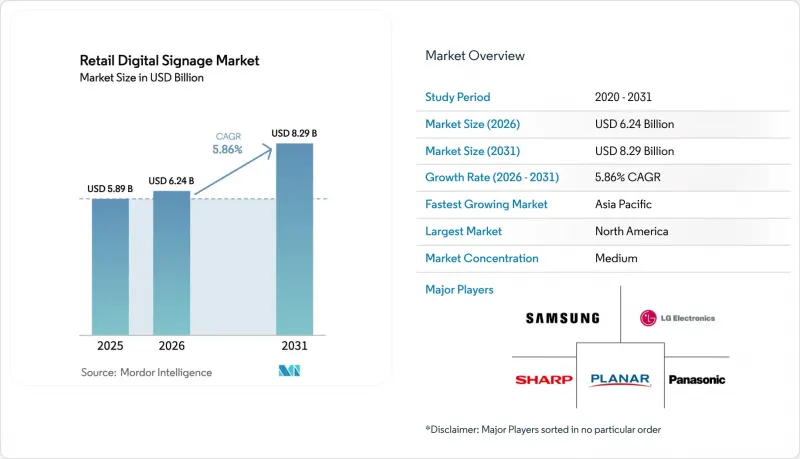
This report is Segmented by Solution (Hardware [Display Technology, and More], Software [Deployment Model, Function], Services [Installation and Integration, and More]), Retail Format (Hypermarkets, and More), Application (In-Store Advertising, and More), Screen Location (Indoor, and More), Screen Size (Below 32 Inch, and More), and Geography. The Market Forecasts are Provided in Terms of Value (USD).
Global Retail Digital Signage Market Trends and Insights
Growing adoption of IoT-enabled shelf-edge displays in European grocery chains
IoT shelf-edge displays now represent the single largest line item in many European grocers' digital budgets. Networked tags sync with ERP systems to correct pricing errors in seconds, an efficiency gain that cuts manual ticketing labor by 85% and supports new transparency rules on nutritional data.Linking the displays to loyalty apps drives personalized promotions at the exact moment of choice; pilots show conversion lifts of 23% when offers flash beside the item. Return on investment accelerates as stores phase out paper, trim printing contracts, and repurpose staff for customer-facing tasks. Success in France and Germany is prompting U.S. big-box chains to test the same architecture in 2025, further scaling the retail digital signage market.
AI-driven shopper analytics fueling interactive signage roll-outs
Seventy-one percent of major U.S. retailers now pair cameras with edge AI to tailor content by age group, attention span, or engagement intensity. Personalization boosts dwell time by 40% and feeds data to merchandising teams that re-order in near real time. Compliance with GDPR and CPRA steers vendors toward anonymous vision processing that discards raw images after extracting metadata, a practice that keeps regulators satisfied while preserving insight depth. Department stores report daily sales lifts of 30% after deploying the technology chain-wide. As costs drop, mid-tier apparel chains are next in line, pushing the retail digital signage market toward experience-centric differentiation rather than price-led competition.
High retrofit CAPEX for legacy convenience-store chains
Full-screen roll-outs can run USD 15,000-25,000 per outlet, a hurdle for fragmented C-store owners with thin margins. Financing is scarce, and economic volatility magnifies risk. Subscription models that shift spending from CAPEX to OPEX offer relief, yet operators worry about lock-in if local currencies fluctuate. The result is a digital divide: large chains wield dynamic pricing while independents stay static, slowing penetration in Latin America even as larger formats flourish.
Other drivers and restraints analyzed in the detailed report include:
- Rapid deployment of 5G private networks enabling real-time UHD content
- LED video-wall cost decline triggering luxury-retail window installations
- Content-refresh cost fatigue among mid-sized European retailers
For complete list of drivers and restraints, kindly check the Table Of Contents.
Segment Analysis
The hardware stack retained a 54.35% share of the retail digital signage market in 2025, buoyed by lower LCD prices and OLED's move into premium flagships. Media players increasingly ship as system-on-chip modules, trimming power draw and cabinet clutter. Samsung's 2024 e-paper launch drew fresh interest in energy-stingy tags for shelf edges.
Cloud software, however, is advancing at a 6.66% CAGR to 2031 and is on track to overtake boxes in lifetime value. Retailers cherish dashboards that orchestrate content to thousands of endpoints in minutes and overlay anonymous analytics for proof of performance. Headless CMS designs decouple creative from device, funneling the retail digital signage market size toward recurring SaaS revenue rather than one-off installs. Expect mergers that fuse CMS, ad trading, and AI personalization into single platforms.
Hypermarkets and supermarkets maintained the largest slice at 33.62%, using networked screens for wayfinding, impulse-buy promos, and dynamic markdowns tied to inventory buffers. Linking signage to ERP forces draws down overstock and spotlights substitutes when favorites sell out, a capability that lifts basket size.
QSRs lead growth at a 7.09% CAGR. Chains such as Wendy's earmarked USD 35 million for AI-enhanced menu boards that upsell combos and tweak pricing by daypart, swelling average checks by 38%. Mall landlords, meanwhile, turn corridors into pDOOH ad networks on revenue-share terms, smoothing deployment risk and nudging more landlords into the retail digital signage market.
Complete Report Scope:
- By Solution
- Hardware
- Display Technology (LCD,LED, OLED, Projection, E-Paper)
- Media Players (Standalone, Networked, System-on-Chip)
- Projectors and Video Walls
- Other Hardware (Mounts, Enclosures)
- Software
- Deployment Model (On-premise, Cloud)
- Function (Content- and Device-Management, Audience Analytics, Scheduling and Distribution)
- Services
- Installation and Integration
- Managed Services
- Maintenance and Support
- Content Creation and Creative Services
- Hardware
- By Retail Format
- Hypermarkets and Supermarkets
- Department Stores
- Convenience and Forecourt Stores
- Specialty Stores
- Shopping Malls and Duty-Free
- QSR and Restaurants
- By Application
- In-Store Advertising and Promotion
- Interactive/Self-Service Kiosks
- Digital Menu Boards
- Product Information and Shelf-Edge Labels
- Wayfinding and Navigation Displays
- Queue-Management/Checkout Screens
- By Screen Location
- Indoor
- Window/Semi-Outdoor
- Outdoor (High-Brightness)
- By Screen Size
- Below 32 inch
- 32 inch - 55 inch
- Above 55 inch
- By Geography
- North America
- United States
- Canada
- Mexico
- Europe
- Germany
- United Kingdom
- France
- Italy
- Spain
- Russia
- Nordics
- Benelux
- Rest of Europe
- Asia-Pacific
- China
- Japan
- South Korea
- India
- Australia and New Zealand
- ASEAN
- Rest of Asia-Pacific
- South America
- Brazil
- Argentina
- Rest of South America
- Middle East and Africa
- Saudi Arabia
- United Arab Emirates
- Turkey
- South Africa
- Nigeria
- Kenya
- Egypt
- Rest of Middle East and Africa
- North America
Geography Analysis
North America commanded 37.45% of the retail digital signage market in 2025. Retailers view screens as omnichannel glue that ties mobile coupons, curbside pickup, and loyalty wallets into one journey. Programmatic DOOH lets malls auction impressions to ad buyers in real time, generating incremental revenue that offsets hardware costs. Privacy laws such as CPRA restrict face-level analytics, steering operators toward aggregated metadata or on-device anonymization. Despite the guardrails, AI adoption remains brisk, and cloud CMS penetration exceeds 75% among Fortune-500 chains, reinforcing the region's lead.
Asia Pacific is the fastest climber at a 7.18% CAGR to 2031, propelled by dense 5G coverage and state mandates such as South Korea's paper-label sunset. Chinese retailers fuse QR-based mobile payment with signage so shoppers can scan and buy without leaving the aisle, compressing funnel stages into seconds. Semiconductor shortages after Taiwan's quake have eased, yet the episode convinced buyers to dual-source media players and panels, embedding resilience into future roll-outs. As domestic OEMs shorten lead times, local retailers gain a cost advantage that fuels further penetration and enlarges the retail digital signage market size.
Europe sits between the two poles, distinguished by stringent GDPR rules that force privacy-safe analytics architectures. IoT shelf-edge displays are ubiquitous in French hypermarkets, where they help satisfy nutritional labeling requirements and automate markdowns near best-by dates. High-resolution LED walls in Milan and Paris luxury districts translate couture storylines into moving art, resetting consumer expectations for storefront theatricality. The Middle East, though smaller, mirrors European luxury trends: Dubai and Riyadh malls increasingly specify digital facades in new-build standards, underscoring marquee status and injecting fresh volume into the regional retail digital signage market.
- Samsung Electronics Co. Ltd.
- LG Electronics Inc.
- Panasonic Holdings Corp.
- Sony Group Corp.
- NEC Corp.
- Sharp Corp.
- Planar Systems Inc. (Leyard)
- Stratacache Inc./Scala
- BrightSign LLC
- Broadsign International Inc.
- Daktronics Inc.
- Mvix Digital Signage LLC
- Cisco Systems Inc.
- Intuiface (IntuiLab)
- Nanolumens Inc.
- Elo Touch Solutions Inc.
- Hughes Network Systems LLC
- AOPEN Inc.
- Novisign Digital Signage Inc.
- Hanshow Technology Co. Ltd.
- Clevertouch (Boxlight)
- Peerless-AV
- Advantech Co. Ltd.
Additional Benefits:
- The market estimate (ME) sheet in Excel format
- 3 months of analyst support
TABLE OF CONTENTS
1 INTRODUCTION
- 1.1 Study Assumptions and Market Definition
- 1.2 Scope of the Study
2 RESEARCH METHODOLOGY
3 EXECUTIVE SUMMARY
4 MARKET LANDSCAPE
- 4.1 Market Overview
- 4.2 Market Drivers
- 4.2.1 Growing adoption of IoT-enabled shelf-edge displays in European grocery chains
- 4.2.2 AI-driven shopper analytics fueling interactive signage roll-outs across North American department stores
- 4.2.3 Rapid deployment of 5G private networks in Asian malls enabling real-time UHD content streaming
- 4.2.4 LED video-wall cost decline (< USD 800/m2) triggering luxury-retail window installations in the Middle East
- 4.2.5 Legislated phase-out of paper price labels in South Korean supermarkets boosting electronic shelf displays
- 4.2.6 Revenue-share ad-network models in United States malls incentivising landlords to install programmatic signage
- 4.3 Market Restraints
- 4.3.1 High retrofit CAPEX for legacy convenience-store chains in South America
- 4.3.2 Content-refresh cost fatigue among mid-sized European retailers
- 4.3.3 GDPR/CPRA compliance limiting depth of in-store audience analytics
- 4.3.4 Semiconductor media-player supply shocks raising lead-times post-Taiwan quake
- 4.4 Industry Ecosystem Analysis
- 4.5 Regulatory Outlook
- 4.6 Technological Outlook
- 4.7 Key Use-Cases of Digital Signage in Retail
- 4.8 Porter's Five Forces Analysis
- 4.8.1 Bargaining Power of Suppliers
- 4.8.2 Bargaining Power of Buyers
- 4.8.3 Threat of New Entrants
- 4.8.4 Threat of Substitutes
- 4.8.5 Intensity of Competitive Rivalry
5 MARKET SIZE AND GROWTH FORECASTS (VALUES)
- 5.1 By Solution
- 5.1.1 Hardware
- 5.1.1.1 Display Technology (LCD,LED, OLED, Projection, E-Paper)
- 5.1.1.2 Media Players (Standalone, Networked, System-on-Chip)
- 5.1.1.3 Projectors and Video Walls
- 5.1.1.4 Other Hardware (Mounts, Enclosures)
- 5.1.2 Software
- 5.1.2.1 Deployment Model (On-premise, Cloud)
- 5.1.2.2 Function (Content- and Device-Management, Audience Analytics, Scheduling and Distribution)
- 5.1.3 Services
- 5.1.3.1 Installation and Integration
- 5.1.3.2 Managed Services
- 5.1.3.3 Maintenance and Support
- 5.1.3.4 Content Creation and Creative Services
- 5.1.1 Hardware
- 5.2 By Retail Format
- 5.2.1 Hypermarkets and Supermarkets
- 5.2.2 Department Stores
- 5.2.3 Convenience and Forecourt Stores
- 5.2.4 Specialty Stores
- 5.2.5 Shopping Malls and Duty-Free
- 5.2.6 QSR and Restaurants
- 5.3 By Application
- 5.3.1 In-Store Advertising and Promotion
- 5.3.2 Interactive/Self-Service Kiosks
- 5.3.3 Digital Menu Boards
- 5.3.4 Product Information and Shelf-Edge Labels
- 5.3.5 Wayfinding and Navigation Displays
- 5.3.6 Queue-Management/Checkout Screens
- 5.4 By Screen Location
- 5.4.1 Indoor
- 5.4.2 Window/Semi-Outdoor
- 5.4.3 Outdoor (High-Brightness)
- 5.5 By Screen Size
- 5.5.1 Below 32 inch
- 5.5.2 32 inch - 55 inch
- 5.5.3 Above 55 inch
- 5.6 By Geography
- 5.6.1 North America
- 5.6.1.1 United States
- 5.6.1.2 Canada
- 5.6.1.3 Mexico
- 5.6.2 Europe
- 5.6.2.1 Germany
- 5.6.2.2 United Kingdom
- 5.6.2.3 France
- 5.6.2.4 Italy
- 5.6.2.5 Spain
- 5.6.2.6 Russia
- 5.6.2.7 Nordics
- 5.6.2.8 Benelux
- 5.6.2.9 Rest of Europe
- 5.6.3 Asia-Pacific
- 5.6.3.1 China
- 5.6.3.2 Japan
- 5.6.3.3 South Korea
- 5.6.3.4 India
- 5.6.3.5 Australia and New Zealand
- 5.6.3.6 ASEAN
- 5.6.3.7 Rest of Asia-Pacific
- 5.6.4 South America
- 5.6.4.1 Brazil
- 5.6.4.2 Argentina
- 5.6.4.3 Rest of South America
- 5.6.5 Middle East and Africa
- 5.6.5.1 Saudi Arabia
- 5.6.5.2 United Arab Emirates
- 5.6.5.3 Turkey
- 5.6.5.4 South Africa
- 5.6.5.5 Nigeria
- 5.6.5.6 Kenya
- 5.6.5.7 Egypt
- 5.6.5.8 Rest of Middle East and Africa
- 5.6.1 North America
6 COMPETITIVE LANDSCAPE
- 6.1 Market Concentration
- 6.2 Strategic Moves and Developments
- 6.3 Market Share Analysis
- 6.4 Company Profiles {(includes Global level Overview, Market level overview, Core Segments, Financials, etc.)}
- 6.4.1 Samsung Electronics Co. Ltd.
- 6.4.2 LG Electronics Inc.
- 6.4.3 Panasonic Holdings Corp.
- 6.4.4 Sony Group Corp.
- 6.4.5 NEC Corp.
- 6.4.6 Sharp Corp.
- 6.4.7 Planar Systems Inc. (Leyard)
- 6.4.8 Stratacache Inc./Scala
- 6.4.9 BrightSign LLC
- 6.4.10 Broadsign International Inc.
- 6.4.11 Daktronics Inc.
- 6.4.12 Mvix Digital Signage LLC
- 6.4.13 Cisco Systems Inc.
- 6.4.14 Intuiface (IntuiLab)
- 6.4.15 Nanolumens Inc.
- 6.4.16 Elo Touch Solutions Inc.
- 6.4.17 Hughes Network Systems LLC
- 6.4.18 AOPEN Inc.
- 6.4.19 Novisign Digital Signage Inc.
- 6.4.20 Hanshow Technology Co. Ltd.
- 6.4.21 Clevertouch (Boxlight)
- 6.4.22 Peerless-AV
- 6.4.23 Advantech Co. Ltd.
7 MARKET OPPORTUNITIES AND FUTURE OUTLOOK
- 7.1 White-Space and Unmet-Need Assessment

