PUBLISHER: Mordor Intelligence | PRODUCT CODE: 2124957

PUBLISHER: Mordor Intelligence | PRODUCT CODE: 2124957
United States Engineering Services - Market Share Analysis, Industry Trends & Statistics, Growth Forecasts (2026 - 2031)
According to Mordor Intelligence, the United States engineering services market size was valued at USD 387.42 billion in 2025 and estimated to grow from USD 409.62 billion in 2026 to reach USD 533.33 billion by 2031, at a CAGR of 5.42% during the forecast period 2026-2031.
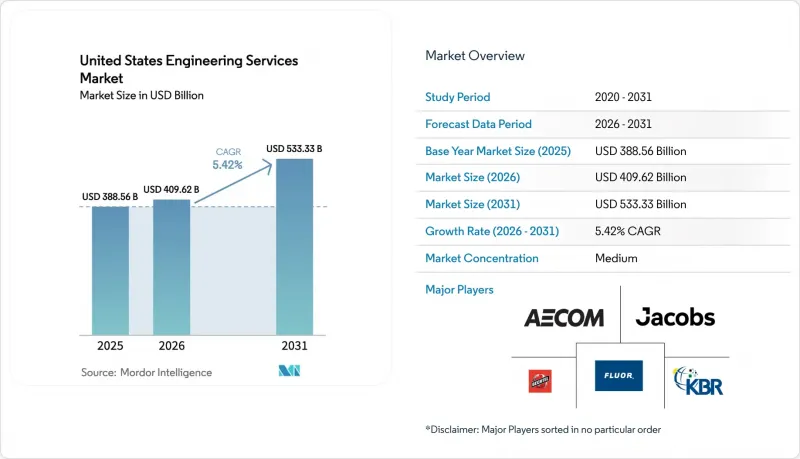
This report is Segmented by Application (Civil, Mechanical, Electrical, Environmental, Chemical, Structural, and Software and Systems), Service Type (Consulting and Design, and More), End-User Industry (Construction and Infrastructure, Oil and Gas, and More), Engagement Model (In-House, and More), and Geography. The Market Forecasts are Provided in Terms of Value (USD).
United States Engineering Services Market Trends and Insights
Federal Infrastructure Funding Under IIJA
The Infrastructure Investment and Jobs Act unlocked USD 550 billion in fresh allocations through 2026, including USD 110 billion for roads and bridges, USD 66 billion for rail, and USD 65 billion for broadband. Design firms are securing front-end planning and construction-management fees as states move stalwart projects like the Brent Spence Bridge replacement and the Gateway Tunnel into procurement. Buy-America clauses are stretching design schedules by up to a year as engineers validate domestic steel and cement supply chains, expanding billable coordination hours. Joint ventures between small and large EPCMs are proliferating to meet bonding thresholds, fragmenting fee pools yet widening participation. Over the medium term, consistent appropriations and streamlined grant disbursement will keep civil and structural backlogs robust.
Accelerating Semiconductor Fabs and Battery Gigafactory Construction
The CHIPS and Science Act's USD 52.7 billion incentive package has catalysed 23 announced fabs between 2024 and 2026. Each facility demands vibration-isolated foundations, ultra-pure water loops, and process exhaust systems, enlarging the addressable scope for mechanical, electrical, and chemical engineers. Battery gigafactories in Georgia, Tennessee, and Michigan are likewise driving cleanroom and high-voltage substation design mandates. Firms are deploying modular templates that standardize tool hook-ups, yet site-specific seismic and environmental constraints preserve the need for bespoke engineering, sustaining premium fee rates.
Persistent Skilled-Labor Shortages Inflating Billing Rates
Forty percent of licensed engineers are over 55, and ABET enrolments fell 3% annually from 2022-2025. Firms are raising entry-level pay by 8-12% a year, compressing margins on fixed-price contracts. Outsourcing low-complexity drafting to India and the Philippines offsets only a portion of labour pressure, as U.S.-based professional seals remain mandatory. Automation tools that autogenerate code-compliant layouts promise relief, yet most regulators accept them only for warehousing and light-industrial typologies, limiting near-term impact.
Other drivers and restraints analyzed in the detailed report include:
- AI-Enabled Digital Twin Adoption Reducing Re-work
- Record Utility-Scale Renewable Interconnection Backlog
- Lengthy NEPA and State Environmental Reviews
For complete list of drivers and restraints, kindly check the Table Of Contents.
Segment Analysis
Civil engineering accounted for 34.59% of the United States engineering services market size in 2025, fuelled by bridge rehabilitation, highway widening, and storm-water upgrades funded under the IIJA. Software and systems engineering is on track for a 5.89% CAGR through 2031 as utilities modernize distribution grids and manufacturers retrofit plants with industrial IoT platforms. Mechanical engineering demand is climbing in parallel with data-center liquid-cooling designs handling 50 kW rack densities, while electrical engineering scopes are expanding with phasor measurement units and automated feeder switches that underpin grid reliability. Environmental engineering continues to capture mandates for PFAS remediation and wetland mitigation, whereas structural specialists gain from seismic-retrofit rules on the West Coast.
The preference for software and systems solutions mirrors owner concern over operational-technology cyber threats, especially across critical infrastructure. Contracts now bundle software coding with OT hardening, creating steady retainer revenue for firms versed in zero-trust architectures. Civil engineering will stay dominant until at least 2028 while IIJA allocations flow, yet growth could taper without fresh congressional surface-transport authorizations at elevated levels. Overall, application diversity cushions the United States engineering services market from cyclical swings in any single discipline.
Consulting and design services captured 38.11% of the 2025 United States engineering services market share as owners required detailed front-end packages to pin down scope and cost before mobilizing capital. Automation and digital engineering is projected to post a 5.67% CAGR through 2031, reflecting BIM Level 2 mandates and digital-twin adoption that compress commissioning cycles. Process and plant engineering rides the semiconductor and battery-plant wave, demanding piping and instrumentation diagrams and hazardous-area classifications ahead of equipment orders. Product engineering remains concentrated within aerospace and defense, where finite-element and thermal modelling validate designs prior to fabrication.
Asset-management scopes are rising as aging bridges and substations need condition assessments and lifecycle modelling. Construction-management demand stays steady, with owners choosing between construction-manager-at-risk and design-build depending on complexity. The United States engineering services market size tied to automation services will advance as clash-detection and 4D scheduling tools become mainstream, reducing the waste that the Associated General Contractors of America pegs at 5-10% of construction budgets. Firms embedding such tools within fixed-fee proposals effectively monetize technology previously borne by owners, sustaining margin resilience.
Complete Report Scope:
- By Application
- Civil
- Mechanical
- Electrical
- Environmental
- Chemical
- Structural
- Software and Systems
- By Service Type
- Consulting and Design
- Process and Plant Engineering
- Product Engineering and Prototyping
- Automation and Digital Engineering
- Asset Management and O&M
- Construction Management
- By End-user Industry
- Construction and Infrastructure
- Oil and Gas
- Manufacturing
- Utilities (Power, Water)
- Transportation (Rail, Airports, Ports)
- Telecommunications and Data Centers
- Healthcare Facilities
- Defense and Aerospace
- Renewable Energy Projects
- By Engagement Model
- In-house
- Outsourced, EPCM
- Public-Private Partnership (PPP) Frameworks
- By Geography
- Northeast
- Midwest
- South
- West
List of Companies Covered in this Report:
- AECOM
- Jacobs Engineering Group Inc.
- Bechtel Corporation
- Fluor Corporation
- KBR, Inc.
- HDR, Inc.
- Terracon Consultants, Inc.
- Black & Veatch Holding Company
- Jensen Hughes, Inc.
- ECS Limited
- WSP USA Inc.
- Tetra Tech, Inc.
- STV Group, Inc.
- Arup US, Inc.
- Gannett Fleming, Inc.
- Burns & McDonnell Engineering Company, Inc.
- HNTB Corporation
- Parsons Corporation
- Louis Berger U.S., Inc.
- AtkinsRealis USA Inc.
- Ghafari Associates, LLC
- Kimley-Horn and Associates, Inc.
- Dewberry Engineers Inc.
- Michael Baker International, Inc.
Additional Benefits:
- The market estimate (ME) sheet in Excel format
- 3 months of analyst support
TABLE OF CONTENTS
1 INTRODUCTION
- 1.1 Study Assumptions and Market Definition
- 1.2 Scope of the Study
2 RESEARCH METHODOLOGY
3 EXECUTIVE SUMMARY
4 MARKET LANDSCAPE
- 4.1 Market Overview
- 4.2 Market Drivers
- 4.2.1 Federal Infrastructure Funding under IIJA
- 4.2.2 Accelerating Semiconductor Fabs and Battery Gigafactory Construction
- 4.2.3 Near-shoring Advanced Manufacturing Lines
- 4.2.4 Record Utility-Scale Renewable Interconnection Backlog
- 4.2.5 Defense Modernization Programs Requiring Specialized Engineering
- 4.2.6 AI-Enabled Digital Twin Adoption Reducing Re-work
- 4.2.7 Climate-Resilience Retrofits of Aging Infrastructure
- 4.2.8 Stricter Building Energy Codes Driving MEP Redesigns
- 4.3 Market Restraints
- 4.3.1 Volatile Steel and Concrete Input-Cost Pass-Through Risk
- 4.3.2 Lengthy NEPA and State Environmental Reviews
- 4.3.3 Persistent Skilled-Labor Shortages Inflating Billing Rates
- 4.3.4 State-by-State Engineering Licensing Variances
- 4.3.5 Rising Professional Liability Insurance Premiums
- 4.4 Industry Value-Chain Analysis
- 4.5 Impact of Macroeconomic Factors on the Market
- 4.6 Regulatory and Technological Outlook
- 4.7 Porter's Five Forces Analysis
- 4.7.1 Bargaining Power of Buyers
- 4.7.2 Bargaining Power of Suppliers
- 4.7.3 Threat of New Entrants
- 4.7.4 Threat of Substitutes
- 4.7.5 Intensity of Competitive Rivalry
- 4.8 Comparative Analysis, In-house vs Outsourced Engineering
- 4.9 Vendor Service Innovation Trends
5 MARKET SIZE AND GROWTH FORECASTS (VALUE)
- 5.1 By Application
- 5.1.1 Civil
- 5.1.2 Mechanical
- 5.1.3 Electrical
- 5.1.4 Environmental
- 5.1.5 Chemical
- 5.1.6 Structural
- 5.1.7 Software and Systems
- 5.2 By Service Type
- 5.2.1 Consulting and Design
- 5.2.2 Process and Plant Engineering
- 5.2.3 Product Engineering and Prototyping
- 5.2.4 Automation and Digital Engineering
- 5.2.5 Asset Management and O&M
- 5.2.6 Construction Management
- 5.3 By End-user Industry
- 5.3.1 Construction and Infrastructure
- 5.3.2 Oil and Gas
- 5.3.3 Manufacturing
- 5.3.4 Utilities (Power, Water)
- 5.3.5 Transportation (Rail, Airports, Ports)
- 5.3.6 Telecommunications and Data Centers
- 5.3.7 Healthcare Facilities
- 5.3.8 Defense and Aerospace
- 5.3.9 Renewable Energy Projects
- 5.4 By Engagement Model
- 5.4.1 In-house
- 5.4.2 Outsourced, EPCM
- 5.4.3 Public-Private Partnership (PPP) Frameworks
- 5.5 By Geography
- 5.5.1 Northeast
- 5.5.2 Midwest
- 5.5.3 South
- 5.5.4 West
6 COMPETITIVE LANDSCAPE
- 6.1 Market Concentration
- 6.2 Strategic Moves
- 6.3 Market Share Analysis
- 6.4 Company Profiles (includes Global Level Overview, Market Level Overview, Core Segments, Financials as available, Strategic Information, Market Rank/Share, Products and Services, Recent Developments)
- 6.4.1 AECOM
- 6.4.2 Jacobs Engineering Group Inc.
- 6.4.3 Bechtel Corporation
- 6.4.4 Fluor Corporation
- 6.4.5 KBR, Inc.
- 6.4.6 HDR, Inc.
- 6.4.7 Terracon Consultants, Inc.
- 6.4.8 Black & Veatch Holding Company
- 6.4.9 Jensen Hughes, Inc.
- 6.4.10 ECS Limited
- 6.4.11 WSP USA Inc.
- 6.4.12 Tetra Tech, Inc.
- 6.4.13 STV Group, Inc.
- 6.4.14 Arup US, Inc.
- 6.4.15 Gannett Fleming, Inc.
- 6.4.16 Burns & McDonnell Engineering Company, Inc.
- 6.4.17 HNTB Corporation
- 6.4.18 Parsons Corporation
- 6.4.19 Louis Berger U.S., Inc.
- 6.4.20 AtkinsRealis USA Inc.
- 6.4.21 Ghafari Associates, LLC
- 6.4.22 Kimley-Horn and Associates, Inc.
- 6.4.23 Dewberry Engineers Inc.
- 6.4.24 Michael Baker International, Inc.
7 MARKET OPPORTUNITIES AND FUTURE OUTLOOK
- 7.1 White-space and Unmet-Need Assessment

