PUBLISHER: Mordor Intelligence | PRODUCT CODE: 2125561

PUBLISHER: Mordor Intelligence | PRODUCT CODE: 2125561
United States Active Pharmaceutical Ingredients (API) - Market Share Analysis, Industry Trends & Statistics, Growth Forecasts (2026 - 2031)
According to Mordor Intelligence, the United States active pharmaceutical ingredients market size was valued at USD 79.63 billion in 2025 and is estimated to grow from USD 85.07 billion in 2026 to reach USD 118.59 billion by 2031, at a CAGR of 6.87% during the forecast period (2026-2031).
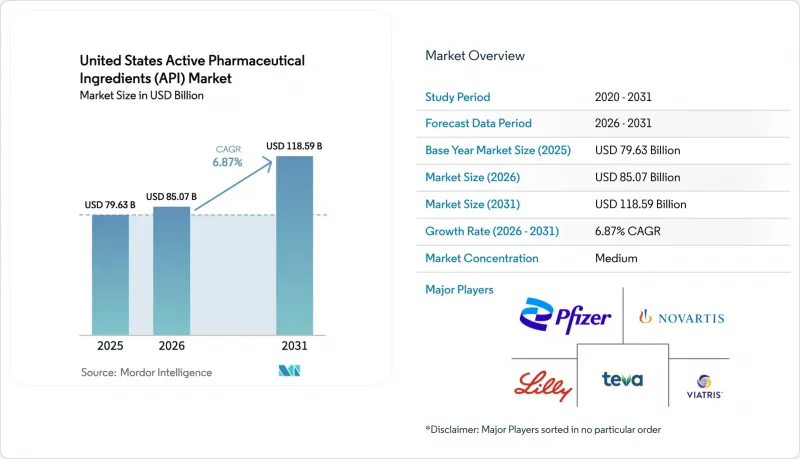
This report is Segmented by Business Mode (Captive API, Merchant API), Synthesis Type (Synthetic, Biotech), Molecule Size (Small-Molecule, Large-Molecule/Biologics), Potency (High-Potency APIs, Low/Medium-Potency APIs), Application (Cardiology, Pulmonology, and More), End User (Pharmaceutical Companies, and More). Market Forecasts are Provided in Terms of Value (USD).
United States Active Pharmaceutical Ingredients (API) Market Trends and Insights
Diversifying U.S. Supply-Chain Incentives for Domestic API Manufacturing
Congressional momentum behind the BIOSECURE Act is forcing pharmaceutical buyers to audit Chinese exposure and shift contracts to domestic plants. Curia, Cambrex, and Amgen have each committed more than USD 100 million to onshore capacity that was previously in Asia. The CHIPS and Science Act extends tax credits to pharmaceutical process equipment, cutting reactor capital costs significantly and narrowing the cost gap with offshore batch assets . States add further support; North Carolina co-financed Amgen's USD 1 billion biologics campus, while Massachusetts fast-tracks GMP permits that meet ISO 14001 standards. All told, stacked incentives bring total-cost-of-ownership below offshore equivalents for molecules that exceed 500 kilograms of annual demand.
Surge in Advanced Biologics & mRNA Therapy Pipelines
Biologics and mRNA therapies accounted for 47% of FDA new molecular entity approvals in 2025, up from 38% in 2020 . Moderna's USD 1.8 billion three-site U.S. build-out halves mRNA batch cycle time from 14 to seven days, giving the firm spare capacity for contract runs. Lonza, Fujifilm, and Thermo Fisher have installed 20,000-liter mammalian bioreactors that target oncology antibodies and autoimmune biologics. Bispecific antibodies and antibody-drug conjugates demand containment at OEB 4-5 levels, a niche where Catalent's Somerset plant and Lonza's Visp site hold leadership. These builds tighten domestic supply and shorten time-to-clinic for sponsors seeking rapid first-in-human studies.
Price Erosion From Medicare Drug-Price Negotiations
Ten high-spend drugs saw list-price cuts of significant amounts in 2024, and 15 more entered the 2025 cycle, trimming contract prices for their small-molecule APIs. The Congressional Budget Office projects a USD 25 billion annual revenue hit by 2031, with generic API suppliers taking the brunt because they lack downstream pricing power. Teva reported a 12% drop in its U.S. API segment during 2025 and shuttered three low-margin lines. CDMOs have responded by raising minimum order quantities and adding raw-material surcharges indexed to solvent prices, shifting some risk back to drug sponsors. The result is a two-tier market where commodity molecules lose pricing power while novel modalities retain premium margins.
Other drivers and restraints analyzed in the detailed report include:
- Federal Funding for Pandemic-Preparedness Stockpiles
- Growing Demand for High-Potency APIs From Oncology Boom
- Environmental Compliance Costs for U.S. API Plants
For complete list of drivers and restraints, kindly check the Table Of Contents.
Segment Analysis
Merchant CDMOs generated 64.58% of 2025 revenue and are forecast to grow at 7.05% through 2031, reflecting their ability to spread fixed costs across multiple sponsors. Continuous-manufacturing penetration reaches six lines at Thermo Fisher's Greenville site versus an industry average of 1.2 lines, letting CDMOs cut cycle time and waste for diverse customers. Captive plants still dominate blockbuster franchises where originators demand supply assurance; Pfizer produces nirmatrelvir API internally to keep pace with emergency surges. However, an industry benchmark shows merchant plants run at 78% average utilization while captive sites languish at 62%, driving new investment toward CDMOs. Continuous upgrades, end-to-end offerings, and speed-to-clinic advantages keep the United States active pharmaceutical ingredients market tilted in favor of merchant players.
Generalist CDMOs co-invest in novel modalities that require capital beyond many biotechs' reach, which further cements merchant leadership. Lonza's USD 1 billion Portsmouth build was co-financed by clients that locked in long-term volume, a model spreading across the United States active pharmaceutical ingredients market. Captive operations remain viable when internal volume is stable and intellectual property is highly sensitive, yet even large originators are outsourcing development-scale lots to access specialized containment or biologics suites.
Synthetic routes still deliver 70.88% of 2025 revenue, but biotech-derived APIs are growing at 7.14% on the back of monoclonal antibody and mRNA approvals. Synthetic manufacturers defend share by focusing on chiral intermediates and controlled substances that carry regulatory moats. Cambrex invested USD 300 million in an Iowa site for DEA Schedule II APIs, shielding that revenue from low-cost Asian competition. Biotech APIs demand 10,000-liter reactors, multicolumn chromatography, and viral-clearance validation that extends tech-transfer timelines. Fujifilm's North Carolina build added 80,000 liters of mammalian capacity to keep pace with oncology antibodies. These complex requirements sustain pricing and reinforce growth for biotech lines within the United States active pharmaceutical ingredients market.
Continuous manufacturing is more advanced on the synthetic side because flow chemistry adapts readily to small molecules. Vertex cut solvent use 30% when it moved ivacaftor and lumacaftor to continuous processing, a performance that synthetic peers now emulate. FDA's ICH Q13 guideline harmonizes review pathways for continuous manufacturing across both chemistries, encouraging more hybrid facilities that host both batch biologics and flow-based small molecules. Synthetic incumbents retain volume leadership, yet biotech's growth trajectory is reshaping capital allocation.
Complete Report Scope:
- By Business Mode
- Captive API
- Merchant API
- By Synthesis Type
- Synthetic
- Biotech
- By Molecule Size
- Small-Molecule
- Large-Molecule / Biologics
- By Potency
- High-Potency APIs (HPAPI)
- Low/Medium-Potency APIs
- By Application
- Cardiology
- Pulmonology
- Oncology
- Ophthalmology
- Neurology
- Orthopedic
- Other Applications
- By End Users
- Pharmaceutical Companies
- CRO and CDMO
- Others
List of Companies Covered in this Report:
- Abbvie
- Amgen
- BASF
- Bristol-Myers Squibb
- Cambrex
- Catalent
- Curia Global, Inc.
- Dr. Reddy's Laboratories Inc.
- Eli Lilly and Company
- Gilead Sciences
- Johnson & Johnson
- Lonza Group
- Lupin
- Mallinckrodt Pharmaceuticals
- Merck
- Novartis Pharmaceuticals Corp.
- Pfizer
- Teva Pharmaceutical Industries
- Thermo Fisher Scientific (Patheon)
- Viatris
Additional Benefits:
- The market estimate (ME) sheet in Excel format
- 3 months of analyst support
TABLE OF CONTENTS
1 Introduction
- 1.1 Study Assumptions & Market Definition
- 1.2 Scope of the Study
2 Research Methodology
3 Executive Summary
4 Market Landscape
- 4.1 Market Overview
- 4.2 Market Drivers
- 4.2.1 Diversifying U.S. Supply-Chain Incentives for Domestic API Manufacturing
- 4.2.2 Surge In Advanced Biologics & mRNA Therapy Pipelines
- 4.2.3 Federal Funding for Pandemic-Preparedness Stockpiles
- 4.2.4 Growing Demand for High-Potency Apis (HPAPIs) From Oncology Boom
- 4.2.5 Adoption Of Continuous Manufacturing Technologies
- 4.2.6 Contract Development & Manufacturing Outsourcing Surge Among Virtual Pharma
- 4.3 Market Restraints
- 4.3.1 Price Erosion from Medicare Drug-Price Negotiations
- 4.3.2 Environmental Compliance Costs for U.S. API Plants
- 4.3.3 Shortage Of Skilled Process Chemists & Engineers
- 4.3.4 Rising Competition from Indian & Chinese Low-Cost Producers
- 4.4 Supply-Chain Analysis
- 4.5 Regulatory Landscape
- 4.6 Technological Outlook
- 4.7 Porter's Five Forces
- 4.7.1 Threat of New Entrants
- 4.7.2 Bargaining Power of Buyers/Consumers
- 4.7.3 Bargaining Power of Suppliers
- 4.7.4 Threat of Substitute Products
- 4.7.5 Intensity of Competitive Rivalry
5 Market Size & Growth Forecasts (Value - USD)
- 5.1 By Business Mode
- 5.1.1 Captive API
- 5.1.2 Merchant API
- 5.2 By Synthesis Type
- 5.2.1 Synthetic
- 5.2.2 Biotech
- 5.3 By Molecule Size
- 5.3.1 Small-Molecule
- 5.3.2 Large-Molecule / Biologics
- 5.4 By Potency
- 5.4.1 High-Potency APIs (HPAPI)
- 5.4.2 Low/Medium-Potency APIs
- 5.5 By Application
- 5.5.1 Cardiology
- 5.5.2 Pulmonology
- 5.5.3 Oncology
- 5.5.4 Ophthalmology
- 5.5.5 Neurology
- 5.5.6 Orthopedic
- 5.5.7 Other Applications
- 5.6 By End Users
- 5.6.1 Pharmaceutical Companies
- 5.6.2 CRO and CDMO
- 5.6.3 Others
6 Competitive Landscape
- 6.1 Market Concentration
- 6.2 Market Share Analysis
- 6.3 Company Profiles (includes Global level Overview, Market level overview, Core Segments, Financials as available, Strategic Information, Market Rank/Share for key companies, Products & Services, and Recent Developments)
- 6.3.1 AbbVie Inc.
- 6.3.2 Amgen Inc.
- 6.3.3 BASF Corporation
- 6.3.4 Bristol-Myers Squibb Company
- 6.3.5 Cambrex Corporation
- 6.3.6 Catalent, Inc.
- 6.3.7 Curia Global, Inc.
- 6.3.8 Dr. Reddy's Laboratories Inc.
- 6.3.9 Eli Lilly and Company
- 6.3.10 Gilead Sciences, Inc.
- 6.3.11 Johnson & Johnson
- 6.3.12 Lonza Group
- 6.3.13 Lupin Pharmaceuticals, Inc.
- 6.3.14 Mallinckrodt Pharmaceuticals
- 6.3.15 Merck & Co., Inc.
- 6.3.16 Novartis Pharmaceuticals Corp.
- 6.3.17 Pfizer Inc.
- 6.3.18 Teva Pharmaceutical Industries Ltd.
- 6.3.19 Thermo Fisher Scientific (Patheon)
- 6.3.20 Viatris Inc.
7 Market Opportunities & Future Outlook
- 7.1 White-space & Unmet-Need Assessment

