PUBLISHER: Mordor Intelligence | PRODUCT CODE: 2125588

PUBLISHER: Mordor Intelligence | PRODUCT CODE: 2125588
Electric Vehicle Battery Coolant - Market Share Analysis, Industry Trends & Statistics, Growth Forecasts (2026 - 2031)
According to Mordor Intelligence, the electric vehicle battery coolant market size was valued at USD 1.98 billion in 2025 and estimated to grow from USD 2.06 billion in 2026 to reach USD 2.57 billion by 2031, at a CAGR of 4.50% during the forecast period (2026-2031).
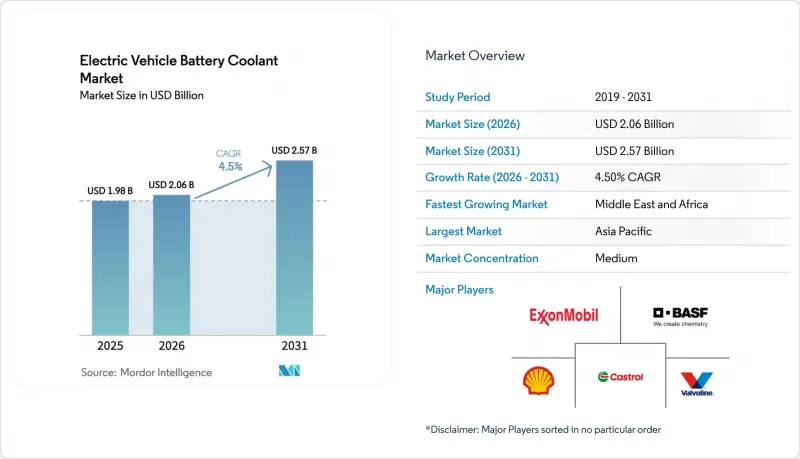
This report is Segmented by Coolant Type (Water-Based Coolants, Dielectric Fluids, and More), Propulsion Type (Battery Electric Vehicles, and More), Vehicle Type (Two-Wheelers, and More), Distribution Channel (Original Equipment Manufacturer, and Aftermarket), End-Use Application (Battery Packs, and More), and Geography. The Market Forecasts are Provided in Terms of Value (USD).
Global Electric Vehicle Battery Coolant Market Trends and Insights
Accelerating Global EV Production Volumes
In 2025, global production of light-duty electric vehicles (EVs) experienced significant growth, driving a corresponding increase in coolant demand proportional to the installed battery capacity. Coolants are essential for maintaining battery performance, with each unit of capacity requiring a specific volume of fluid. However, despite the rise in production, revenue growth has not kept pace. This is primarily due to a majority of platforms continuing to use low-margin glycol blends. A prominent EV manufacturer, BYD, exemplifies this trend by relying on legacy coolants, highlighting the gap between production volume and revenue generation. Consequently, suppliers are shifting their focus from sheer volume growth to enhancing product attributes such as thermal conductivity and dielectric strength. This shift is particularly evident in European and North American markets, where original equipment manufacturers (OEMs) are willing to invest in premium fluids that enable rapid charging. This has created a divided market landscape, where unit expansion and value creation are increasingly decoupled.
OEM Shift Toward Liquid-Cooled Battery Packs
To meet range and charging expectations, automakers have largely moved away from air-cooled packs. General Motors' Ultium platform circulates glycol-water through cold plates, enabling high-performance DC charging with a slight increase in material costs per vehicle. Tesla's 4680 structural pack uses coolant channels between cylindrical cells, achieving reduced mass and an extended cycle life. Ford and Volkswagen adopt similar designs, while BASF clinches a proprietary blend contract for MEB-based models. Liquid cooling has evolved into a warranty hedge, ensuring consistent demand throughout industry cycles.
High Unit Cost of Specialized EV Coolants
Dielectric and nanofluid products are significantly more expensive than glycol, limiting their adoption in price-sensitive markets. Engineered Fluids' BitCool is priced at a level justified primarily in racing or immersion-cooling applications, where warranty risks are heightened. OEMs are unlikely to accept such a premium unless the fluid can demonstrably reduce charge time significantly or extend battery life substantially-benefits currently validated only in lab settings. While BASF is making strides with its G40 EV at a comparatively lower price, it still leads to an increase in total vehicle material costs in markets where affordability heavily influences purchasing decisions.
Other drivers and restraints analyzed in the detailed report include:
- Expansion of Fast-Charging Infrastructure
- Stringent Safety Rules on Thermal-Runaway Mitigation
- Volatile Glycol Feed-Stock Prices
For complete list of drivers and restraints, kindly check the Table Of Contents.
Segment Analysis
Water-based blends secured 56.10% of 2025 revenue as automakers favored mature supply chains and low price points. Dielectric fluids captured a notable share serving 800-volt architectures, while advanced nanofluids are set for a 7.18% CAGR as graphene additives raise thermal conductivity and carve a premium niche . The electric vehicle battery coolant market size for nanofluids is projected to climb significantly by 2031, underscoring performance-led adoption. Longer-term uptake hinges on stabilizer chemistries that prevent particle agglomeration over ten-year duty cycles.
Secondarily, the electric vehicle battery coolant market faces a glide path where incremental nanoparticle adoption into glycol matrices boosts conductivity without breaching OEM filter-clog risk thresholds. Suppliers offering validated 3,000-hour dispersion data stand to win early contracts, but extended durability proof remains the gating factor for full-scale rollouts.
Battery electric vehicles accounted for 73.12% of 2025 demand, equating to an electric vehicle battery coolant market size that grows in line with global electric vehicle (EV) deliveries. Fuel cell electric vehicles, though niche, will post the highest 10.36% CAGR as hydrogen trucks and buses demand dielectric fluids. This dynamic secures outsized margins for specialty chemical suppliers even as absolute liters remain modest. Plug-in hybrids shrink over the horizon period, reinforcing battery electric vehicle (BEV) primacy in coolant volume.
Inherent stack voltage and higher waste-heat generation make fuel cell electric vehicles (FCEVs) reliant on fluorocarbon-based dielectrics, positioning early movers with patent-protected formulations to capture a disproportionate share of future contracts.
Complete Report Scope:
- By Coolant Type
- Water-Based Coolants
- Dielectric Fluids (Non-conductive Oils)
- Advanced Nanofluids
- By Propulsion Type
- Battery Electric Vehicles (BEVs)
- Hybrid Electric Vehicles (HEVs)
- Plug-in Hybrid Electric Vehicles (PHEVs)
- Fuel Cell Electric Vehicles (FCEVs)
- By Vehicle Type
- Two-Wheelers
- Three-Wheelers
- Passenger Cars
- Commercial Vehicles
- Off-Highway EVs
- By Distribution Channel
- Original Equipment Manufacturer (OEM)
- Aftermarket
- By End-Use Application
- Battery Packs
- Motors and Power Electronics
- By Geography
- North America
- United States
- Canada
- Rest of North America
- South America
- Brazil
- Argentina
- Rest of South America
- Europe
- Germany
- United Kingdom
- France
- Italy
- Spain
- Rest of Europe
- Asia-Pacific
- China
- India
- Japan
- South Korea
- Rest of Asia-Pacific
- Middle East and Africa
- United Arab Emirates
- Saudi Arabia
- South Africa
- Turkey
- Rest of Middle East and Africa
- North America
Geography Analysis
Asia-Pacific generated 46.13% of 2025 revenue, anchored by China's significant electric vehicle (EV) sales and the GB 38031 rule that mandates liquid cooling for packs above 50 kWh. BYD sources low-cost glycol from Sinopec, squeezing foreign suppliers on price, while India's FAME-II policy pushes liquid cooling into premium two-wheelers that tackle summer temperatures above 40 °C. Japan remains a niche dielectric hub for fuel-cell buses, and South Korea's GS Caltex secures captive demand from Hyundai-Kia 800-volt models.
Europe delivered a notable share of global revenue in 2025 as CO2 fleet penalties and PFAS-free rules raised per-liter costs and favored suppliers with compliant chemistries. Volkswagen's significant regional electric vehicle (EV) sales underpin a BASF supply pact that guarantees volume but dictates tight conductivity limits. North America added a significant share; the Inflation Reduction Act content rules channel OEMs to domestic glycol plants in Texas and Ontario, accelerating reshoring investments while protecting margins against import volatility.
The Middle East and Africa, though only a nominal share of the 2025 volume, post a 6.15% CAGR as Gulf taxi electrification demands high-temperature-stable coolants. Saudi funding of Lucid's Jeddah plant seeds a regional blending opportunity for early movers. South America contributes 3% of revenue, with Brazil's ethanol heritage spurring bio-based propylene glycol that trims fossil reliance and supports local value chains.
- Exxon Mobil Corporation
- BASF SE
- Shell plc
- Castrol Limited (BP p.l.c.)
- Valvoline Inc.
- TotalEnergies SE
- FUCHS SE
- Prestone Products Corporation
- Arteco NV
- Dober
- GS Caltex Corporation
- Engineered Fluids
- XING Mobility
- Motul S.A.
Additional Benefits:
- The market estimate (ME) sheet in Excel format
- 3 months of analyst support
TABLE OF CONTENTS
1 Introduction
- 1.1 Study Assumptions and Market Definition
- 1.2 Scope of the Study
2 Research Methodology
3 Executive Summary
4 Market Landscape
- 4.1 Market Overview
- 4.2 Market Drivers
- 4.2.1 Accelerating Global Electric Vehicle Production Volumes
- 4.2.2 Original Equipment Manufacture (OEM) Shift Toward Liquid-Cooled Battery Packs
- 4.2.3 Expansion of Fast-Charging Infrastructure
- 4.2.4 Stringent Safety Rules on Thermal-Runaway Mitigation
- 4.2.5 800-V Architectures Boosting Dielectric-Fluid Demand
- 4.2.6 Two/Three-Wheeler Electric Vehicle Boom in Hot Climates
- 4.3 Market Restraints
- 4.3.1 High Unit Cost of Specialized Electric Vehicle Coolants
- 4.3.2 Volatile Glycol Feed-Stock Prices
- 4.3.3 No Universal Standard on Coolant Conductivity
- 4.3.4 Solid-State Batteries May Cut Thermal Load
- 4.4 Value / Supply-Chain Analysis
- 4.5 Regulatory Landscape
- 4.6 Technological Outlook
- 4.7 Porter's Five Forces
- 4.7.1 Threat of New Entrants
- 4.7.2 Bargaining Power of Suppliers
- 4.7.3 Bargaining Power of Buyers
- 4.7.4 Threat of Substitutes
- 4.7.5 Industry Rivalry
5 Market Size and Growth Forecasts (Value, USD)
- 5.1 By Coolant Type
- 5.1.1 Water-Based Coolants
- 5.1.2 Dielectric Fluids (Non-conductive Oils)
- 5.1.3 Advanced Nanofluids
- 5.2 By Propulsion Type
- 5.2.1 Battery Electric Vehicles (BEVs)
- 5.2.2 Hybrid Electric Vehicles (HEVs)
- 5.2.3 Plug-in Hybrid Electric Vehicles (PHEVs)
- 5.2.4 Fuel Cell Electric Vehicles (FCEVs)
- 5.3 By Vehicle Type
- 5.3.1 Two-Wheelers
- 5.3.2 Three-Wheelers
- 5.3.3 Passenger Cars
- 5.3.4 Commercial Vehicles
- 5.3.5 Off-Highway EVs
- 5.4 By Distribution Channel
- 5.4.1 Original Equipment Manufacturer (OEM)
- 5.4.2 Aftermarket
- 5.5 By End-Use Application
- 5.5.1 Battery Packs
- 5.5.2 Motors and Power Electronics
- 5.6 By Geography
- 5.6.1 North America
- 5.6.1.1 United States
- 5.6.1.2 Canada
- 5.6.1.3 Rest of North America
- 5.6.2 South America
- 5.6.2.1 Brazil
- 5.6.2.2 Argentina
- 5.6.2.3 Rest of South America
- 5.6.3 Europe
- 5.6.3.1 Germany
- 5.6.3.2 United Kingdom
- 5.6.3.3 France
- 5.6.3.4 Italy
- 5.6.3.5 Spain
- 5.6.3.6 Rest of Europe
- 5.6.4 Asia-Pacific
- 5.6.4.1 China
- 5.6.4.2 India
- 5.6.4.3 Japan
- 5.6.4.4 South Korea
- 5.6.4.5 Rest of Asia-Pacific
- 5.6.5 Middle East and Africa
- 5.6.5.1 United Arab Emirates
- 5.6.5.2 Saudi Arabia
- 5.6.5.3 South Africa
- 5.6.5.4 Turkey
- 5.6.5.5 Rest of Middle East and Africa
- 5.6.1 North America
6 Competitive Landscape
- 6.1 Market Concentration
- 6.2 Strategic Moves
- 6.3 Market Share Analysis
- 6.4 Company Profiles (includes Global Level Overview, Market Level Overview, Core Segments, Financials as Available, Strategic Information, Market Rank/Share for Key Companies, Products and Services, SWOT Analysis, and Recent Developments)
- 6.4.1 Exxon Mobil Corporation
- 6.4.2 BASF SE
- 6.4.3 Shell plc
- 6.4.4 Castrol Limited (BP p.l.c.)
- 6.4.5 Valvoline Inc.
- 6.4.6 TotalEnergies SE
- 6.4.7 FUCHS SE
- 6.4.8 Prestone Products Corporation
- 6.4.9 Arteco NV
- 6.4.10 Dober
- 6.4.11 GS Caltex Corporation
- 6.4.12 Engineered Fluids
- 6.4.13 XING Mobility
- 6.4.14 Motul S.A.
7 Market Opportunities & Future Outlook
- 7.1 White-Space & Unmet-Need Assessment

