PUBLISHER: Mordor Intelligence | PRODUCT CODE: 2154213

PUBLISHER: Mordor Intelligence | PRODUCT CODE: 2154213
Rice Protein - Market Share Analysis, Industry Trends & Statistics, Growth Forecasts (2026 - 2031)
According to Mordor Intelligence, the rice protein market size hit USD 385.53 million in 2026 and is projected to climb to USD 534.05 million by 2031, reflecting a 6.73% CAGR.
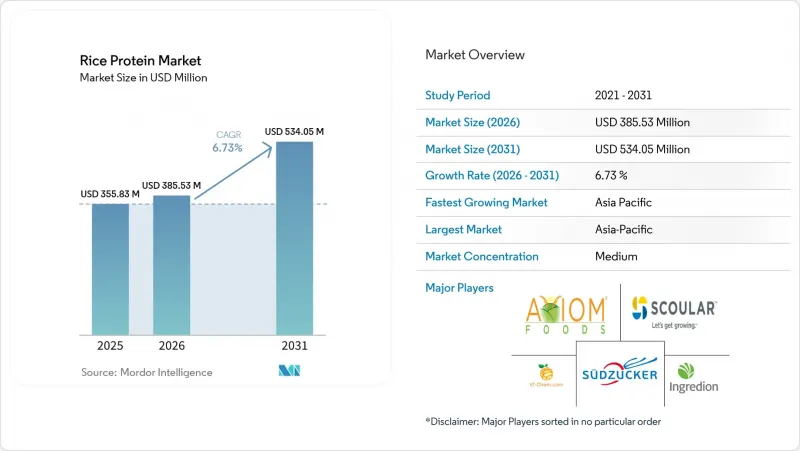
Global Rice Protein Market Trends and Insights
Rising Demand for Plant-Based Proteins in Sports Nutrition
Peer-reviewed trials show muscle-protein synthesis rates equal to whey when leucine is co-supplemented, boosting the rice protein market among athletes. North American and European specialty retailers have expanded shelf space for blends that couple rice with pea or hemp to deliver complete amino-acid profiles. Hydrolyzed variants ease chalky mouthfeel, helping ready-to-drink shakes address texture complaints. Axiom Foods leverages clinical data to position Oryzatein as a hypoallergenic option for lactose-intolerant consumers. The sports-nutrition channel is therefore growing at roughly double the overall rice protein market, even though flavor challenges remain a hurdle
Increasing Vegan and Lactose-Intolerant Consumer Base
Approximately 65% to 70% of the global population exhibits some degree of lactose malabsorption, with prevalence exceeding 90% among individuals of East Asian descent. This genetic reality, coupled with the rise of flexitarian diets, is pushing food manufacturers to reformulate dairy-centric products with plant proteins. According to the latest findings from The Vegan Society, around 2 million individuals in Great Britain in 2024, or 3% of the population, now identify as vegan or adhere to a plant-based diet. Rice protein appeals to this cohort because it is inherently free of the top 8 allergens and carries a "clean" label perception relative to soy, which faces GMO concerns in certain markets. However, the segment's growth is tempered by competition from oat, almond, and pea proteins that deliver creamier textures in plant-based milk and yogurt applications. Suppliers that invest in enzymatic modification to improve emulsification and water-holding capacity will capture a disproportionate share of dairy-alternative innovation pipelines.
High Production Cost vs. Pea and Soy Protein
Rice grain contains 7% to 9% protein by weight, compared to 35% to 45% in soybeans and 20% to 25% in yellow peas, meaning processors must handle 4 to 6 times more raw material to yield equivalent isolate volumes. This mass imbalance drives up energy, water, and enzyme costs in alkaline-extraction or enzymatic-hydrolysis workflows. While broken rice trades at a discount, the capital intensity of protein-separation equipment and the need for multi-stage purification to remove starch and fiber erode the margin. Ingredion and Lantmannen's November 2024 announcement of a EUR 100 million+ pea-protein facility in Sweden, scheduled for 2027 commissioning, underscores how competitors are scaling legume-based capacity to capture cost-sensitive food manufacturers. Rice-protein suppliers can partially offset this disadvantage by co-locating extraction plants at rice mills to minimize logistics and by targeting premium applications-infant formula, sports nutrition, cosmetics, where hypoallergenicity commands a price premium that absorbs higher input costs.
Other drivers and restraints analyzed in the detailed report include:
- Cost Advantages from Up-Cycling Broken Rice Streams
- Clean-Label Positioning Strengthens Brand Differentiation
- Arsenic-Related Supply Chain Scrutiny and Batch Rejections
For complete list of drivers and restraints, kindly check the Table Of Contents.
Segment Analysis
Isolates captured 49.30% of the rice protein market share in 2025, fueled by near-neutral taste and >=80% protein purity demanded by sports drinks and plant-based shakes. Hydrolyzed rice protein ranks as the fastest-growing form, expanding at 7.70% annually thanks to peptide sizes that boost solubility and accelerate gastric absorption. Concentrates at 60% to 70% protein remain popular in cost-conscious bakery and snack lines, yet their share is slipping as brands pursue higher protein claims that isolates deliver. Textured rice protein, produced via extrusion, is a niche but steadily adopted in Asian meat analogs. Suppliers that deploy multi-enzyme cascades, such as alcalase for primary cleavage and flavourzyme for bitterness reduction, can command premium pricing in elderly and clinical nutrition, and this capability is expected to support the rice protein market size for hydrolysates through 2031.
Concentrates and textured formats together accounted for roughly half of the 2025 volume, but cost pressure from pea and soy keeps their growth in check. Hydrolyzed variants attract infant-formula brands seeking minimal allergenicity, yet higher processing costs limit use in budget categories. Axiom Foods' Oryzatein 2.0 isolate, launched in January 2025, raises the performance bar with a white, grit-free powder that stays suspended in clear drinks. The long-term trajectory will hinge on scaling hydrolysis economically and masking residual bitterness to maintain consumer acceptance.
Complete Report Scope:
- By Form
- Concentrates
- Isolates
- Textured/Hydrolyzed
- By End-User
- Food and Beverages
- Bakery
- Beverages
- Meat/ Poultry/Seafood and Meat Alternative Products
- Snacks
- Personal Care and Cosmetics
- Supplements
- Elderly Nutrition and Medical Nutrition
- Sport/Performance Nutrition
- Food and Beverages
- By Geography
- North America
- United States
- Canada
- Mexico
- Rest of North America
- Europe
- Germany
- United Kingdom
- Italy
- France
- Spain
- Netherlands
- Russia
- Rest of Europe
- Asia-Pacific
- China
- India
- Japan
- Australia
- Indonesia
- South Korea
- Thailand
- Singapore
- Rest of Asia-Pacific
- South America
- Brazil
- Argentina
- Rest of South America
- Middle East and Africa
- South Africa
- Saudi Arabia
- United Arab Emirates
- Nigeria
- Turkey
- Rest of Middle East and Africa
- North America
Geography Analysis
Asia-Pacific owned 33.87% of global revenue in 2025 and is projected to post a 7.53% CAGR to 2031, the top regional rate. Abundant broken rice, coupled with expanding plant-based meat consumption aligned with Buddhist and Hindu dietary norms, underpins growth. Chinese processors in Hunan and Jiangxi convert low-grade grain into 80% isolates for export. India's occasional non-basmati export bans have tightened supply, yet domestic demand is climbing as urban consumers seek lactose-free proteins. Japan and South Korea command premium prices for organic, low-arsenic isolates used in infant-formula and cosmetics. The USDA projects ample rice supplies through 2025, supporting the rice protein market even amid policy swings.
North America and Europe together delivered roughly 45% of the 2025 value, buoyed by sports nutrition and plant-based infant formula. The FDA's arsenic limit concentrates U.S. demand among certified suppliers, raising entry barriers. Europe's protein landscape is diversifying as BENEO's EUR 50 million faba-bean plant launched in April 2025 and Ingredion-Lantmannen's forthcoming pea facility intensify legume-protein competition. Rice-protein suppliers thus differentiate on hypoallergenicity rather than price to retain share.
South America and the Middle East and Africa remain nascent but promising. Brazil's vegan community is expanding, and the UAE's food-security initiatives favor local production of plant proteins. Limited milling infrastructure and consumer awareness constrain immediate volumes, yet rising health consciousness could spur uptake post-2028. Across all regions, suppliers that operate dual supply chains commodity concentrates for local food processing and certified isolates for export can hedge against regulatory divergence and price sensitivity.
- Axiom Foods Inc.
- ET Chem
- Sudzucker AG
- The Scoular Company
- Ingredion Incorporated
- Kerry Group plc
- Shafi Gluco Chem (pvt) Ltd.
- Golden Grain Group Ltd.
- Shaanxi Fuheng (FH) Biology Co. Ltd.
- The Green Labs LLC
- AIDP Inc.
- BENEO GmbH
- Nutribiotic
- Rizsource International
- Roquette Freres
- Bioway (Xioan) Organic Ingredients
- Anhui Shunxin Shengyuan Biotech
- Hubei Jiayuan Group
- RiceBran Technologies
- Suzhou Dongyuan Bio-Chem
- Hebei Tianxu Biotech
- Wuxi Jinnong International
- A. Costantino & C. spa
Additional Benefits:
- The market estimate (ME) sheet in Excel format
- 3 months of analyst support
TABLE OF CONTENTS
1 INTRODUCTION
- 1.1 Study Assumptions and Market Definition
- 1.2 Scope of the Study
2 RESEARCH METHODOLOGY
3 EXECUTIVE SUMMARY
4 MARKET LANDSCAPE
- 4.1 Market Overview
- 4.2 Market Drivers
- 4.2.1 Rising demand for plant-based proteins in sports nutrition
- 4.2.2 Increasing vegan and lactose-intolerant consumer base
- 4.2.3 Favorable regulations for hypo-allergenic infant nutrition
- 4.2.4 Functional edge of rice protein in high-moisture meat analog extrusion
- 4.2.5 Cost advantages from up-cycling broken rice streams
- 4.2.6 Clean-label positioning strengthens brand differentiation
- 4.3 Market Restraints
- 4.3.1 High production cost vs. pea and soy protein
- 4.3.2 Gritty mouthfeel limits use in certain beverages
- 4.3.3 Limited solubility/functionality in acidic matrices
- 4.3.4 Arsenic-related supply chain scrutiny and batch rejections
- 4.4 Value/Supply-Chain Analysis
- 4.5 Regulatory Landscape
- 4.6 Technological Outlook
- 4.7 Porter's Five Forces Analysis
- 4.7.1 Threat of New Entrants
- 4.7.2 Bargaining Power of Suppliers
- 4.7.3 Bargaining Power of Buyers
- 4.7.4 Threat of Substitutes
- 4.7.5 Competitive Rivalry
5 MARKET SIZE AND GROWTH FORECASTS (VALUE AND VOLUME, 2021-2031)
- 5.1 By Form
- 5.1.1 Concentrates
- 5.1.2 Isolates
- 5.1.3 Textured/Hydrolyzed
- 5.2 By End-User
- 5.2.1 Food and Beverages
- 5.2.1.1 Bakery
- 5.2.1.2 Beverages
- 5.2.1.3 Meat/ Poultry/Seafood and Meat Alternative Products
- 5.2.1.4 Snacks
- 5.2.2 Personal Care and Cosmetics
- 5.2.3 Supplements
- 5.2.3.1 Elderly Nutrition and Medical Nutrition
- 5.2.3.2 Sport/Performance Nutrition
- 5.2.1 Food and Beverages
- 5.3 By Geography
- 5.3.1 North America
- 5.3.1.1 United States
- 5.3.1.2 Canada
- 5.3.1.3 Mexico
- 5.3.1.4 Rest of North America
- 5.3.2 Europe
- 5.3.2.1 Germany
- 5.3.2.2 United Kingdom
- 5.3.2.3 Italy
- 5.3.2.4 France
- 5.3.2.5 Spain
- 5.3.2.6 Netherlands
- 5.3.2.7 Russia
- 5.3.2.8 Rest of Europe
- 5.3.3 Asia-Pacific
- 5.3.3.1 China
- 5.3.3.2 India
- 5.3.3.3 Japan
- 5.3.3.4 Australia
- 5.3.3.5 Indonesia
- 5.3.3.6 South Korea
- 5.3.3.7 Thailand
- 5.3.3.8 Singapore
- 5.3.3.9 Rest of Asia-Pacific
- 5.3.4 South America
- 5.3.4.1 Brazil
- 5.3.4.2 Argentina
- 5.3.4.3 Rest of South America
- 5.3.5 Middle East and Africa
- 5.3.5.1 South Africa
- 5.3.5.2 Saudi Arabia
- 5.3.5.3 United Arab Emirates
- 5.3.5.4 Nigeria
- 5.3.5.5 Turkey
- 5.3.5.6 Rest of Middle East and Africa
- 5.3.1 North America
6 COMPETITIVE LANDSCAPE
- 6.1 Market Concentration
- 6.2 Strategic Moves
- 6.3 Market Share Analysis
- 6.4 Company Profiles (includes Global level Overview, Market level overview, Core Segments, Financials as available, Strategic Information, Market Rank/Share for key companies, Products and Services, and Recent Developments)
- 6.4.1 Axiom Foods Inc.
- 6.4.2 ET Chem
- 6.4.3 Sudzucker AG
- 6.4.4 The Scoular Company
- 6.4.5 Ingredion Incorporated
- 6.4.6 Kerry Group plc
- 6.4.7 Shafi Gluco Chem (pvt) Ltd.
- 6.4.8 Golden Grain Group Ltd.
- 6.4.9 Shaanxi Fuheng (FH) Biology Co. Ltd.
- 6.4.10 The Green Labs LLC
- 6.4.11 AIDP Inc.
- 6.4.12 BENEO GmbH
- 6.4.13 Nutribiotic
- 6.4.14 Rizsource International
- 6.4.15 Roquette Freres
- 6.4.16 Bioway (Xioan) Organic Ingredients
- 6.4.17 Anhui Shunxin Shengyuan Biotech
- 6.4.18 Hubei Jiayuan Group
- 6.4.19 RiceBran Technologies
- 6.4.20 Suzhou Dongyuan Bio-Chem
- 6.4.21 Hebei Tianxu Biotech
- 6.4.22 Wuxi Jinnong International
- 6.4.23 A. Costantino & C. spa
7 MARKET OPPORTUNITIES AND FUTURE OUTLOOK

