PUBLISHER: Mordor Intelligence | PRODUCT CODE: 2155272

PUBLISHER: Mordor Intelligence | PRODUCT CODE: 2155272
Vision-Based Quality Analytics - Market Share Analysis, Industry Trends & Statistics, Growth Forecasts (2026 - 2031)
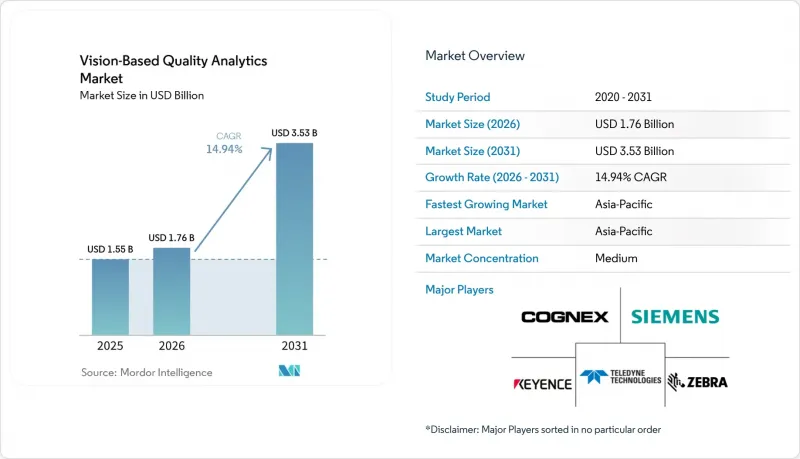
According to Mordor Intelligence, the vision-based quality analytics market size is projected to expand from USD 1.55 billion in 2025 and USD 1.76 billion in 2026 to USD 3.53 billion by 2031, registering a CAGR of 14.94% between 2026 to 2031.
Global Vision-Based Quality Analytics Market Trends and Insights
Rapid Transition From Manual Inspection to Automated AI-Powered Defect Recognition
Manual inspection is becoming harder to sustain when production volumes rise and defect tolerance narrows. A consumer goods manufacturer replaced manual spot checks with unsupervised edge-based anomaly detection and targeted a reduction in inspection labor from 40% to 4% of its plant workforce. The vision-based quality analytics market benefits when manufacturers extend inspection to steps that previously lacked full coverage due to time or cost constraints. TSMC uses NVIDIA Metropolis and the NVIDIA TAO Toolkit to improve nanometer-scale defect classification while reducing the need for repeated labeling and retraining as conditions change. A VCSEL inspection study using 22,410 images reported 98.7% accuracy and reduced per-unit inspection time from 17.7 seconds to 1.5 seconds. The same study reported an 89% reduction in inspection time and a 4.5-month hardware payback period.
Increasing Demand for High-Precision Visual Analytics in EV Battery and Semiconductor Fabrication
Battery and semiconductor production both require close control because a single defect can jeopardize an entire lot, module, or finished product. The vision-based quality analytics market, therefore, has high-value applications in these production environments. Researchers presented AOI-SSL at the CVPR 2026 workshop as a self-supervised approach for wire-bonded semiconductor inspection, using domain-specific vision transformer pretraining on smaller inspection datasets. The LIBAD benchmark, released in August 2026, includes 744 electrode samples from real roll-to-roll production lines and covers 11 defect categories. It combines visible-light imaging, high-resolution X-ray, and inline-compatible X-ray radiography. Cell formats, including cylindrical, prismatic, and pouch designs, require inspection systems that can adapt to different configurations and defect patterns.
High Upfront Deployment Costs and Integration Complexity with Legacy Machinery
The vision-based quality analytics market faces a practical barrier in facilities that use older, PLC-driven equipment and have limited data infrastructure. A pilot usually requires manual fallback, evaluation milestones, and connectivity to a manufacturing execution system before an AI inspection system is ready for full production. Smaller manufacturers find the cost of commercial automated optical inspection systems. A VCSEL study described hardware-constrained architectures designed for settings where larger incumbent platforms are not feasible. Older plants may also lack the high-throughput, low-latency connectivity needed to link cameras, edge nodes, and enterprise systems. Neurala reported that its L-DNN technology can train and infer without cloud connectivity or GPU hardware, which addresses facilities with limited deployment capacity.
Other drivers and restraints analyzed in the detailed report include:
- Proliferation of Edge Computing Platforms Enabling Real-Time In-Line Quality Assessment
- Rising Shift Toward Predictive Quality Analytics to Reduce Scrap Rates and Rework Costs
- Scarcity of High-Quality Labeled Training Datasets for Rare Industrial Defect Models
For complete list of drivers and restraints, kindly check the Table Of Contents.
Segment Analysis
Defect and Anomaly Analytics held 32.67% share in 2025, making it the largest analytics category in the vision-based quality analytics market. Electronics, automotive, and food-processing lines use this category for surface and structural checks to determine whether a unit passes or fails. Installed automated optical inspection systems generate classification records that can be shared with manufacturing execution systems. Dimensional and Measurement Analytics supports precision metrology in high-mix discrete manufacturing. Pattern and Classification Analytics supports component identification and traceability in automotive and electronics assembly.
Predictive Quality Analytics is forecast to expand at a 15.56% CAGR through 2031. The vision-based quality analytics industry is adopting predictive tools because end-of-line detection does not recover the cost of material or processing already consumed. Process Quality Analytics links inspection results with upstream process variables and supports earlier corrective action. Other Analytics Types include specialized applications that are emerging in individual production settings. The SECOM study showed how a closed-loop model could adapt as process conditions change.
Traditional Rule-Based Analytics commanded a 43.67% share in 2025, reflecting an installed base of systems built around fixed thresholds, edge-detection filters, and geometric rules. These systems remain useful where products and operating conditions are stable. The vision-based quality analytics market still depends on rule-based methods for validated tasks that require consistent logic. Their limits become clearer when lighting, product variants, or process parameters change. A systematic review reported that YOLO-based approaches achieved 98.6% mAP on PCB defect datasets.
AI/Deep Learning-Based Analytics is forecast to grow at a 15.63% CAGR through 2031. The vision-based quality analytics industry is using deep learning, where hand-configured rules struggle with varied or complex features. The same review reported that HSA-RTDETR reached 96.9% mAP at 66.2 FPS for a 6-defect PCB inspection task. Hybrid AI and Rule-Based Analytics preserves validated rules for predictable checks while applying AI to variable conditions. SICK announced updated capabilities for its Nova platform, including tools for 3D data processing and neural-network object detection, for its Vision 2026 showcase.
Complete Report Scope:
- By Analytics Type
- Defect and Anomaly Analytics
- Dimensional and Measurement Analytics
- Pattern and Classification Analytics
- Process Quality Analytics
- Predictive Quality Analytics
- Other Analytics Types
- By Technology
- AI / Deep Learning-Based Analytics
- Traditional Rule-Based Analytics
- Hybrid AI and Rule-Based Analytics
- By Deployment
- Edge / On-Premises
- Cloud-Based
- Hybrid
- By End-User Industry
- Electronics and Semiconductors
- EV and Battery Manufacturing
- Automotive
- Pharmaceutical and Medical Devices
- Food and Beverage
- Aerospace and Defense
- Logistics and Warehousing
- Other End-User Industries
- By Geography
- North America
- United States
- Canada
- Mexico
- South America
- Brazil
- Argentina
- Chile
- Rest of South America
- Europe
- Germany
- United Kingdom
- France
- Italy
- Spain
- Rest of Europe
- Asia-Pacific
- China
- Japan
- India
- South Korea
- Australia
- Rest of Asia-Pacific
- Middle East
- United Arab Emirates
- Saudi Arabia
- Qatar
- Rest of Middle East
- Africa
- South Africa
- Egypt
- Nigeria
- Rest of Africa
- North America
Geography Analysis
Asia-Pacific held 36.12% share in 2025 and is forecast to grow at a 16.21% CAGR through 2031. The vision-based quality analytics market has its largest regional base in Asia-Pacific because China, South Korea, Japan, and Taiwan have dense semiconductor, electronics, and battery production. China is expanding domestic semiconductor capacity, while South Korea has DRAM and OLED clusters. Japan supports VCSEL and automotive sensor manufacturing, and Taiwan has advanced foundry operations. India is an emerging demand location because semiconductor incentives and expanding electronics manufacturing services are supporting future inspection adoption.
The LIBAD benchmark released in August 2026 used real roll-to-roll production data and 3 imaging methods for battery electrode inspection. This work reflects the increasing complexity of quality requirements as regional battery capacity grows. Vietnam, Thailand, and Malaysia also contribute to demand as supply chains add precision production capacity. North America is the second-largest region, with demand across semiconductor manufacturing, pharmaceuticals, aerospace and defense, and automotive inspection. The United States has major demand in Arizona and Texas semiconductor clusters, the Great Lakes automotive corridor, and East Coast pharmaceutical and biotechnology facilities.
The FDA Quality Management System Regulation became effective on February 2, 2026, and incorporated ISO 13485:2016 by reference into 21 CFR Part 820. This creates documentation and validation requirements for vision inspection systems in U.S. medical device facilities. Canada supports specialized demand through Ontario automotive suppliers and Quebec aerospace manufacturers, while Mexico adds electronics manufacturing activity. Europe is led by Germany's automotive, robotics, and precision engineering sectors. France, the United Kingdom, and Italy contribute through aerospace components, pharmaceuticals, and food processing. South America, the Middle East, and Africa remain smaller demand areas centered on Brazil, the UAE, and South Africa, where cloud and hybrid models can lower infrastructure requirements.
- Cognex Corporation
- Keyence Corporation
- Zebra Technologies Corporation
- Siemens AG
- Teledyne Technologies Incorporated
- Omron Corporation
- Basler AG
- SICK AG
- Landing AI
- Instrumental Inc.
- Sight Machine Inc.
- Neurala Inc.
- Overview, Inc.
- Pleora Technologies Inc.
- Elementary Robotics, Inc.
- Amazon Web Services, Inc.
- Google LLC
- Microsoft Corporation
- Kitov Systems Ltd. (Kitov.ai)
Additional Benefits:
- The market estimate (ME) sheet in Excel format
- 3 months of analyst support
TABLE OF CONTENTS
1 INTRODUCTION
- 1.1 Study Assumptions and Market Definition
- 1.2 Scope of the Study
2 RESEARCH METHODOLOGY
3 EXECUTIVE SUMMARY
4 MARKET LANDSCAPE
- 4.1 Market Overview
- 4.2 Market Drivers
- 4.2.1 Rapid Transition from Manual Quality Inspection to Automated AI-Powered Defect Recognition
- 4.2.2 Increasing Demand for High-Precision Visual Analytics in EV Battery and Semiconductor Fabrication
- 4.2.3 Proliferation of Edge Computing Platforms Enabling Real-Time In-Line Quality Assessment
- 4.2.4 Rising Shift Toward Predictive Quality Analytics to Reduce Scrap Rates and Rework Costs
- 4.2.5 Tightening Regulatory and Traceability Standards Across Medical Devices and Pharmaceuticals
- 4.2.6 Growing Implementation of Hybrid AI and Rule-Based Algorithms for Complex Surface and Assembly Inspection
- 4.3 Market Restraints
- 4.3.1 High Upfront Deployment Costs and Integration Complexity with Legacy Machinery
- 4.3.2 Scarcity of High-Quality Labeled Training Datasets for Rare Industrial Defect Models
- 4.3.3 Optical and Environmental Vulnerabilities Affecting Model Accuracy on High-Speed Production Lines
- 4.3.4 Shortage of Specialized Technical Talent to Maintain Edge Machine Learning Workflows
- 4.4 Impact of Macroeconomic Factors on the Market
- 4.5 Industry Value Chain Analysis
- 4.6 Regulatory Landscape
- 4.7 Technological Outlook
- 4.8 Porter's Five Forces Analysis
- 4.8.1 Threat of New Entrants
- 4.8.2 Bargaining Power of Suppliers
- 4.8.3 Bargaining Power of Buyers
- 4.8.4 Threat of Substitutes
- 4.8.5 Competitive Rivalry
5 MARKET SIZE AND GROWTH FORECASTS (VALUE)
- 5.1 By Analytics Type
- 5.1.1 Defect and Anomaly Analytics
- 5.1.2 Dimensional and Measurement Analytics
- 5.1.3 Pattern and Classification Analytics
- 5.1.4 Process Quality Analytics
- 5.1.5 Predictive Quality Analytics
- 5.1.6 Other Analytics Types
- 5.2 By Technology
- 5.2.1 AI / Deep Learning-Based Analytics
- 5.2.2 Traditional Rule-Based Analytics
- 5.2.3 Hybrid AI and Rule-Based Analytics
- 5.3 By Deployment
- 5.3.1 Edge / On-Premises
- 5.3.2 Cloud-Based
- 5.3.3 Hybrid
- 5.4 By End-User Industry
- 5.4.1 Electronics and Semiconductors
- 5.4.2 EV and Battery Manufacturing
- 5.4.3 Automotive
- 5.4.4 Pharmaceutical and Medical Devices
- 5.4.5 Food and Beverage
- 5.4.6 Aerospace and Defense
- 5.4.7 Logistics and Warehousing
- 5.4.8 Other End-User Industries
- 5.5 By Geography
- 5.5.1 North America
- 5.5.1.1 United States
- 5.5.1.2 Canada
- 5.5.1.3 Mexico
- 5.5.2 South America
- 5.5.2.1 Brazil
- 5.5.2.2 Argentina
- 5.5.2.3 Chile
- 5.5.2.4 Rest of South America
- 5.5.3 Europe
- 5.5.3.1 Germany
- 5.5.3.2 United Kingdom
- 5.5.3.3 France
- 5.5.3.4 Italy
- 5.5.3.5 Spain
- 5.5.3.6 Rest of Europe
- 5.5.4 Asia-Pacific
- 5.5.4.1 China
- 5.5.4.2 Japan
- 5.5.4.3 India
- 5.5.4.4 South Korea
- 5.5.4.5 Australia
- 5.5.4.6 Rest of Asia-Pacific
- 5.5.5 Middle East
- 5.5.5.1 United Arab Emirates
- 5.5.5.2 Saudi Arabia
- 5.5.5.3 Qatar
- 5.5.5.4 Rest of Middle East
- 5.5.6 Africa
- 5.5.6.1 South Africa
- 5.5.6.2 Egypt
- 5.5.6.3 Nigeria
- 5.5.6.4 Rest of Africa
- 5.5.1 North America
6 COMPETITIVE LANDSCAPE
- 6.1 Market Concentration
- 6.2 Strategic Moves
- 6.3 Market Share Analysis
- 6.4 Company Profiles (includes Global Level Overview, Market Level Overview, Core Segments, Financials as available, Strategic Information, Market Rank/Share, Products and Services, Recent Developments)
- 6.4.1 Cognex Corporation
- 6.4.2 Keyence Corporation
- 6.4.3 Zebra Technologies Corporation
- 6.4.4 Siemens AG
- 6.4.5 Teledyne Technologies Incorporated
- 6.4.6 Omron Corporation
- 6.4.7 Basler AG
- 6.4.8 SICK AG
- 6.4.9 Landing AI
- 6.4.10 Instrumental Inc.
- 6.4.11 Sight Machine Inc.
- 6.4.12 Neurala Inc.
- 6.4.13 Overview, Inc.
- 6.4.14 Pleora Technologies Inc.
- 6.4.15 Elementary Robotics, Inc.
- 6.4.16 Amazon Web Services, Inc.
- 6.4.17 Google LLC
- 6.4.18 Microsoft Corporation
- 6.4.19 Kitov Systems Ltd. (Kitov.ai)
7 MARKET OPPORTUNITIES AND FUTURE OUTLOOK
- 7.1 White-Space and Unmet-Need Assessment

