PUBLISHER: Mordor Intelligence | PRODUCT CODE: 2157143

PUBLISHER: Mordor Intelligence | PRODUCT CODE: 2157143
Indonesia Reverse Logistics - Market Share Analysis, Industry Trends & Statistics, Growth Forecasts (2026 - 2031)
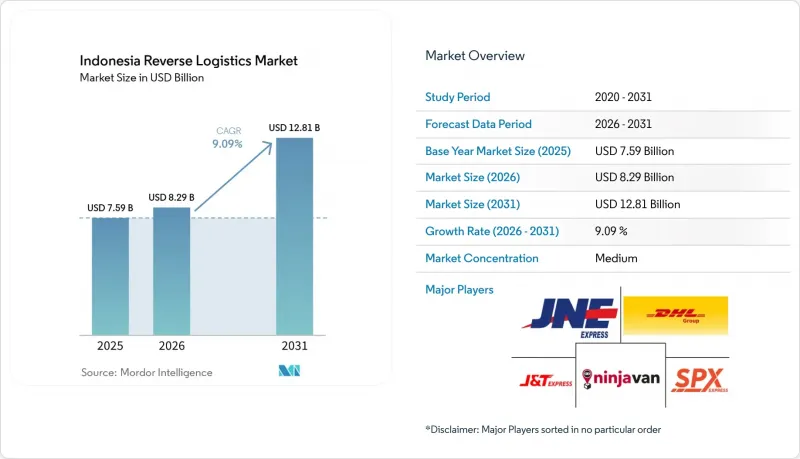
According to Mordor Intelligence, the Indonesia reverse logistics market size was valued at USD 7.59 billion in 2025 and is estimated to grow from USD 8.29 billion in 2026 to reach USD 12.81 billion by 2031, at a CAGR of 9.09% during the forecast period (2026-2031).
Indonesia Reverse Logistics Market Trends and Insights
E-commerce Returns Increasing Demand for Reverse Logistics
Indonesia's digital marketplaces created return flows that differed from those in predominantly card-based economies. Cash-on-delivery delivery failures accounted for more than 20% of shipments and added returns beyond products that consumers sent back because they were unwanted or defective. Product quality ranked ahead of delivery experience and return-policy clarity as a reason for consumer returns in Indonesian B2C e-commerce. TikTok Shop's June 2026 policy requires sellers to bear part of the return logistics costs, up to USD 0.62 per reverse transaction, which shows the financial burden of returns within platform operations. This mix of failed deliveries and consumer-led returns expanded the work available to specialist providers. It also made cost control and faster collection more important across the Indonesia reverse logistics market. The combination also required providers to handle returns that began with a failed delivery differently from products returned after use or inspection, because collection timing, condition review, seller communication, inventory status, and the suitable final route could vary even when both parcels moved through the same marketplace network.
Customer Expectations Accelerating Faster Product Return Processing
Return-processing time became a more important part of merchant retention and seller economics as customer expectations increased. A study of Indonesian FMCG warehouses found that uncertainty in return volume reduced warehouse performance, while return information quality played an important role in operational outcomes. This made inspection records, condition codes, and clear disposition decisions valuable for providers handling growing return volumes. SiCepat Logistik launched in July 2026 with tracking, dashboard APIs, and digital pickup-to-return scheduling capabilities. These tools reduced avoidable manual steps between collection and final disposition. Faster processing became especially important for healthcare and consumer electronics returns, where errors might create financial or compliance consequences. A more reliable process also enables sellers to receive clearer status updates, warehouses to prepare staff and space for incoming goods, and operators to separate goods for restocking, repair, recovery, or further transport without waiting for incomplete information.
Fragmented Recovery Networks Limiting Reverse Logistics Efficiency
Many Tier 2 and Tier 3 locations lacked nearby facilities for return inspection, repair, or resale preparation. Providers often had to absorb several transport legs or wait until enough goods accumulated to justify a consolidated shipment. A study across 34 provinces found that stronger port connectivity reduced inter-island price variation by 4.7-6.2%, although retail price gaps changed little after sea-route investment. The finding indicated that forward-distribution improvements had not fully resolved last-mile and return-mile constraints. The Sea Toll Program completed 756 voyages and moved 32,732 TEUs to 104 ports in 2025, but comparable investment in return-flow infrastructure remained limited. Consolidation services for fragmented flows in Sulawesi, Kalimantan, and Sumatra remained a clear opportunity within the Indonesia reverse logistics market. Without predictable return volumes, providers faced a difficult choice between holding goods for an efficient load or moving them sooner at a higher unit cost, and both choices could delay recovery, restocking, or final disposition.
Other drivers and restraints analyzed in the detailed report include:
- Circular Economy Priorities Strengthening Product Value Recovery
- Producer Take-Back Obligations Supporting Organized Reverse Logistics
- Inter-Island Returns Increasing Transportation and Handling Costs
For complete list of drivers and restraints, kindly check the Table Of Contents.
Segment Analysis
Transportation held 43.25% of the Indonesia reverse logistics market share in 2025, reflecting the cost of inter-city, inter-island, and last-mile return movement. Road transport carried much of the volume along Java and major Sumatran routes, where collection points, sortation facilities, and fulfillment centers were more closely linked. This mode remained essential when returns needed routine movement between consumers, sellers, warehouses, and consolidation sites. Air transport handled time-sensitive pharmaceutical returns and high-value electronics that required a faster turnaround and closer control. Its role was narrower in volume terms, but it remained important when condition, timing, and chain-of-custody requirements limited the use of slower modes. Sea consolidation under other modes gained relevance for returns that were less time-sensitive and could be grouped into economic loads. SiCepat's Fast Lane inter-island sea-freight service provided a lower-cost alternative to air freight for suitable outer-island returns. The service reflected a need to match transport choice with the product's value, required turnaround, and island location. It also showed that providers could reduce reverse movement costs by avoiding a single-mode approach. J&T Express had 127 sortation centers across Southeast Asia by mid-2026, including 6 units added during the first half and 75 automated sorting lines. This infrastructure showed the scale needed to receive, scan, separate, and redirect rising transport volumes efficiently.
Other value-added services had the fastest forecast growth at 12.45% CAGR from 2026 to 2031. Warehousing remained the second-largest function because returned goods needed staging, inspection, grading, and disposition before restocking or resale. These sites gave operators time to verify the item, record its condition, and decide whether it could return to sale, move to repair, or enter a recovery channel. Warehousing also limited unnecessary long-distance movements by allowing operators to consolidate goods before a further transfer. This group included return processing, refurbishment, restocking, and final disposition. Its growth reflected greater attention to the recoverable value of returned inventory rather than only the cost of moving it. Blibli's Fulfillment at Speed platform served 100 brands and recorded cumulative GMV of USD 200 million in the 2 years after its 2024 external launch. The platform illustrated how brands could combine storage, order fulfillment, and return handling across online and offline channels. Such arrangements reduced handoffs between separate service providers and improved visibility over returned stock. They also supported quicker decisions on restocking, resale, repair, recycling, or disposal. Producer responsibility rules could further support demand for compliant repair, recovery, and disposition services. These functions increased the importance of operational capability beyond transport in the Indonesia reverse logistics market.
Complete Report Scope:
- By Reverse Logistics Function
- Transportation
- Road
- Air
- Other Modes
- Warehousing (Storage, Distribution, Consolidation)
- Other Value-added Services (Return Processing, Restocking, Refurbishment, Disposition)
- Transportation
- By End-user Industry
- Consumer and Retail
- Home and Decor
- Healthcare and Pharmaceuticals
- FMCG
- Other End Users
- By Region
- Java (Jakarta and BOD)
- Sumatra
- Kalimantan
- Sulawesi
- Bali and Nusa Tenggara
- Papua Region and Maluku Islands
List of Companies Covered in this Report:
- DHL Group
- DSV A/S
- Kuehne+Nagel
- CMA CGM Group (Including CEVA Logistics)
- GEODIS
- Rhenus Group
- NX Group
- FedEx
- United Parcel Service of America, Inc. (UPS)
- Shipper
- JNE Express
- J&T Express
- SPX Express
- Pos Indonesia
- Ninja Van (Including Ninja Xpress)
- SiCepat Ekspres
- Paxel
- Access Logistik
- Anteraja
- Gojek Logistics (GoSend/GoTo Logistics)
- Wahana Prestasi Logistik
- KAI Logistik
Additional Benefits:
- The market estimate (ME) sheet in Excel format
- 3 months of analyst support
TABLE OF CONTENTS
1 INTRODUCTION
- 1.1 Study Assumptions and Market Definition
- 1.2 Scope of the Study
2 RESEARCH METHODOLOGY
3 EXECUTIVE SUMMARY
- 3.1 Market Size, Growth, and Forecast Outlook
- 3.2 Key Demand Drivers and Reverse Logistics Trends
- 3.3 Major Return Flows and Demand Concentration
- 3.4 Competitive Landscape and Leading Reverse Logistics Providers
4 MARKET LANDSCAPE
- 4.1 Market Overview and Importance of Reverse Logistics
- 4.2 Market Drivers
- 4.2.1 E-commerce Returns Increasing Demand for Reverse Logistics
- 4.2.2 Customer Expectations Accelerating Faster Product Return Processing
- 4.2.3 Circular Economy Priorities Strengthening Product Value Recovery
- 4.2.4 Producer Take-Back Obligations Supporting Organized Reverse Logistics
- 4.2.5 Recommerce Growth Expanding Returned Inventory Recovery Channels
- 4.2.6 Secondary-City Expansion Creating New Reverse Logistics Opportunities
- 4.3 Market Restraints
- 4.3.1 Fragmented Recovery Networks Limiting Reverse Logistics Efficiency
- 4.3.2 Inter-Island Returns Increasing Transportation and Handling Costs
- 4.3.3 Poor Return Data Standardization Increasing Processing Complexity
- 4.3.4 Return Fraud and Counterfeiting Increasing Operational Risks
- 4.4 Value Chain Structure and Reverse Logistics Flow Analysis
- 4.5 Regulatory Framework and Reverse Logistics Compliance Analysis
- 4.6 Technology Adoption and Reverse Logistics Digitalization Analysis
- 4.7 Evolution of Reverse Logistics Requirements
- 4.8 Study on Changing Consumer Behavior and Preferences
- 4.9 Impact of Cost of Returns on Retailers - Analyst View
- 4.10 Porter's Five Forces Analysis
- 4.10.1 Threat of New Entrants
- 4.10.2 Bargaining Power of Buyers
- 4.10.3 Bargaining Power of Suppliers
- 4.10.4 Threat of Substitute Services
- 4.10.5 Intensity of Competitive Rivalry
- 4.11 Impact of Geo-Political Events on Supply Chain Shifts
5 MARKET SIZE AND GROWTH FORECASTS
- 5.1 By Reverse Logistics Function
- 5.1.1 Transportation
- 5.1.1.1 Road
- 5.1.1.2 Air
- 5.1.1.3 Other Modes
- 5.1.2 Warehousing (Storage, Distribution, Consolidation)
- 5.1.3 Other Value-added Services (Return Processing, Restocking, Refurbishment, Disposition)
- 5.1.1 Transportation
- 5.2 By End-user Industry
- 5.2.1 Consumer and Retail
- 5.2.2 Home and Decor
- 5.2.3 Healthcare and Pharmaceuticals
- 5.2.4 FMCG
- 5.2.5 Other End Users
- 5.3 By Region
- 5.3.1 Java (Jakarta and BOD)
- 5.3.2 Sumatra
- 5.3.3 Kalimantan
- 5.3.4 Sulawesi
- 5.3.5 Bali and Nusa Tenggara
- 5.3.6 Papua Region and Maluku Islands
6 COMPETITIVE LANDSCAPE
- 6.1 Market Concentration
- 6.2 Strategic Moves
- 6.3 Market Share Analysis
- 6.4 Company Profiles (includes Global Level Overview, Market Level Overview, Core Segments, Financials as available, Strategic Information, Geographic Coverage, Products and Services, Recent Developments)
- 6.4.1 DHL Group
- 6.4.2 DSV A/S
- 6.4.3 Kuehne+Nagel
- 6.4.4 CMA CGM Group (Including CEVA Logistics)
- 6.4.5 GEODIS
- 6.4.6 Rhenus Group
- 6.4.7 NX Group
- 6.4.8 FedEx
- 6.4.9 United Parcel Service of America, Inc. (UPS)
- 6.4.10 Shipper
- 6.4.11 JNE Express
- 6.4.12 J&T Express
- 6.4.13 SPX Express
- 6.4.14 Pos Indonesia
- 6.4.15 Ninja Van (Including Ninja Xpress)
- 6.4.16 SiCepat Ekspres
- 6.4.17 Paxel
- 6.4.18 Access Logistik
- 6.4.19 Anteraja
- 6.4.20 Gojek Logistics (GoSend/GoTo Logistics)
- 6.4.21 Wahana Prestasi Logistik
- 6.4.22 KAI Logistik
7 MARKET OPPORTUNITIES AND FUTURE OUTLOOK
- 7.1 White-Space Opportunities and Unmet Reverse Logistics Needs
- 7.2 High-Potential End-User Segments and Growth Opportunities
- 7.3 Strategic Growth Priorities Across Reverse Logistics Ecosystem
- 7.4 Future Market Outlook and Emerging Return Demand Pockets
8 APPENDIX

