PUBLISHER: Mordor Intelligence | PRODUCT CODE: 2187245

PUBLISHER: Mordor Intelligence | PRODUCT CODE: 2187245
Active Pharmaceutical Ingredients (API) - Market Share Analysis, Industry Trends & Statistics, Growth Forecasts (2027 - 2032)
According to Mordor Intelligence, the active pharmaceutical ingredients (API) market size is expected to grow from USD 245.7 billion in 2026 to USD 263.5 billion in 2027 and is forecast to reach USD 368.7 billion by 2032 at 6.95% CAGR over 2027-2032.
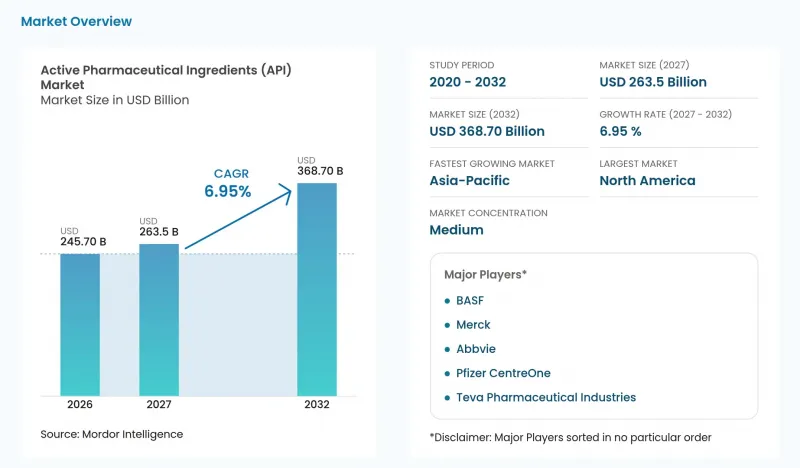
This report is segmented by API Type (Synthetic APIs and more), Manufacturer Model (Captive / In-house and more), Molecule Size (Small Molecule and more), Therapeutic Area (Cardiovascular and more), and Geography (North America and more). The market forecasts are provided in terms of value (USD), based on availability.
Global Active Pharmaceutical Ingredients (API) Market Trends and Insights
Escalating Chronic-Disease Drug Demand
Large treated populations make chronic-disease medicines a substantial source of recurring requirements for their active ingredients. Novo Nordisk reached 42 million people with its diabetes portfolio in 2025, delivering 4% sales growth at constant exchange rates for that portfolio. WHO's 2025 Model Lists added treatments for various cancers and diabetes with associated comorbidities, and the lists serve as a basis for public procurement in over 150 countries. Inclusion can widen the institutional route to treatment, although national procurement decisions determine whether that route becomes additional medicine supply. Novo Nordisk recorded DKK 88.47 billion (USD 13.36 billion) in 2025 US sales of Ozempic, its type 2 diabetes medicine, illustrating the commercial scale a single chronic-disease franchise can support for ingredient suppliers.
Biologics & Targeted-Therapy Pipeline Expansion
New treatment indications can extend demand across several active ingredients within a single approved regimen. The FDA approved epcoritamab with rituximab and lenalidomide for relapsed or refractory follicular lymphoma on November 18, 2025, following an international phase 3 trial. Epcoritamab is a T-cell-engaging bispecific antibody. Using the approved combination requires supply of all 3 active ingredients for patients receiving that regimen. If more eligible patients with relapsed or refractory follicular lymphoma receive the regimen, commercial ingredient demand can increase for the antibody and both companion agents together.
Rising Global GMP & Nitrosamine-Control Compliance Costs
Nitrosamine control can make the commercial quality requirement for an API depend on its customer's finished medicine. EMA's October 2025 Q&A requires marketing-authorization holders and applicants to ensure robust evaluations by relevant manufacturing authorization holders and API manufacturers for EU human medicines containing chemically synthesized APIs. A given finished product may need additional API tests or tighter limits than the pharmacopeial monograph to control nitrosamine impurities. The Active Pharmaceutical Ingredients Committee's 2025 guidance reported that some API companies faced customer requests to verify very low amine content against historical impurity limits, without a settled convention for reasonable levels. Suppliers can consequently face product-specific verification work beyond a standard ingredient specification, adding a customer-dependent burden to compliant production.
Other drivers and restraints analyzed in the detailed report include:
- Outsourced Manufacturing Cost Advantages
- Continuous-Flow & Mini-Plant Technologies Gain Traction
- Generic-Price Compression Squeezing API Margins
For complete list of drivers and restraints, kindly check the Table Of Contents.
Segment Analysis
Synthetic APIs accounted for a 65.25% share of the active pharmaceutical ingredients (API) market size in 2026. WuXi AppTec reported that its small-molecule API reactor volume exceeded 4,000 kiloliters at the end of 2025. Cambrex reported in 2026 that 80% of its customer molecules require advanced chemical expertise. Within the largest segment, production scale and expertise in complex synthesis address different parts of a pharmaceutical developer's needs, connecting manufacturing infrastructure with the chemistry required for its specific molecule. For a producer serving a portfolio like Cambrex's, reactor expansion alone would not resolve the chemistry work required to convert customer projects into manufacturing business.
Biological APIs are forecast to grow at 8.92% CAGR over 2027-2032, making them the fastest-growing segment. As of June 30, 2026, WuXi Biologics' Chengdu commercial drug-substance and drug-product site had reached structural completion and received key equipment. Its microbial-biologics design included a 15,000-liter fermenter and capacity for up to 110 drug-substance batches annually, with GMP release expected by the end of 2026. The stated annual capacity is a ceiling rather than realized output, so its contribution to biological API supply depends on achieving GMP release and then using that capacity.
Captive and in-house production represented a 50.58% active pharmaceutical ingredients (API) market share in 2026. In FY2025, Aurobindo Pharma met 52% of its own API requirements internally for finished dosage form manufacturing. The company identifies subsidiary Apitoria Pharma as leading its API business. Within this largest segment, internal ingredient manufacturing connects with the same group's downstream medicine requirements, giving production assets a use tied to finished dosage forms. Captive manufacturing can therefore underpin a formulation business without making the pharmaceutical group fully self-sufficient in its ingredient requirements.
Merchant and outsourced manufacturing is forecast to grow at 9.5% CAGR over 2027-2032, making it the fastest-growing segment. William Blair analysts found that contract development and manufacturing organizations (CDMOs) produced APIs for 73% of drugs approved by the US FDA in 2025. Among small-molecule drugs approved that year, 89% used outsourced API manufacturing. External manufacturing was consequently embedded in many newly approved products, linking contract suppliers with the commercialization pathway for medicines developed by other companies. This creates a growth route through participation in approved therapies, allowing a manufacturing business to gain work as its customers bring medicines through regulatory review and into commercial supply.
Complete Report Scope:
- By API Type
- Synthetic APIs
- Biological APIs
- Highly-Potent APIs (HPAPIs)
- Natural / Phytochemical APIs
- By Manufacturer Model
- Captive / In-house
- Merchant / Outsourced
- By Molecule Size
- Small Molecule
- Large Molecule / Biologics
- By Therapeutic Area
- Oncology
- Cardiovascular
- Infectious Diseases
- Metabolic Disorders
- CNS & Neurology
- Other Therapeutic Area
- By Geography
- North America
- United States
- Canada
- Mexico
- Europe
- Germany
- United Kingdom
- France
- Italy
- Spain
- Rest of Europe
- Asia-Pacific
- China
- Japan
- India
- Australia
- South Korea
- Rest of Asia-Pacific
- Middle East & Africa
- GCC
- South Africa
- Rest of Middle East & Africa
- South America
- Brazil
- Argentina
- Rest of South America
- North America
Geography Analysis
North America accounted for 39.28% of the active pharmaceutical ingredients (API) market size in 2026. On August 13, 2026, the International Finance Corporation (IFC) signed financing for Neolpharma's Mexico expansion, including acquisition, refurbishment and reactivation of an API plant in Morelos. The broader project also included a third-party injectables facility in Toluca and upgrades at existing sites, with disbursement pending at the August 16 status update. The API component gives the regional manufacturing base an expansion route through asset refurbishment, alongside investment in finished-product services. Commercial value depends on turning the agreed project scope into operating ingredient capacity, so the manufacturing contribution follows execution of the reactivation work.
Asia-Pacific is forecast to grow at 10% CAGR over 2027-2032, making it the fastest-growing geography. In 2026, BioDuro's joint venture with Taiwan-based Cenra added 10 GMP API production lines and more than 350,000 liters of reactor capacity to BioDuro's network. The collaboration connects process development with clinical and commercial-scale manufacturing, bringing an established Taiwanese API producer together with a contract research, development and manufacturing business. The added lines let BioDuro pursue later-stage API orders as development projects mature, creating a route for customer relationships to generate additional clinical and commercial manufacturing work in Taiwan.
Within Europe, the Commission's 2025 analysis of the European Directorate for the Quality of Medicines & HealthCare certification database showed EU reliance on external chemical API production sites. In the Middle East & Africa, CAD Middle East Pharmaceutical Industries manufactures APIs in Riyadh, Saudi Arabia. Egypt's Arab API laid a January 2026 foundation stone for an Ain Sokhna factory planned to supply active and inactive ingredients and related materials for local pharmaceutical manufacturing and regional exports. In South America, BNDES approved financing in September 2026 for CYG Biotech, a Grupo Blanver company, to expand API capacity through a planned Indaiatuba, Brazil, unit. The commercial distinction is whether a supplier serves established cross-border production networks or develops local ingredient capacity whose contribution depends on completing planned facilities.
- Abbvie
- Aurobindo Pharma
- BASF
- Boehringer Ingelheim
- Cambrex
- Catalent
- Cipla
- Dr. Reddy's Laboratories
- GlaxoSmithKline
- Lonza Group
- Merck
- Novartis
- Pfizer CentreOne
- Piramal Group
- Recipharm
- Samsung Group
- Siegfried AG
- Sun Pharmaceuticals Industries
- Teva Pharmaceutical Industries
- WuXi App Tec
Additional Benefits:
- The market estimate (ME) sheet in Excel format
- 3 months of analyst support
TABLE OF CONTENTS
1 INTRODUCTION
- 1.1 Study Assumptions and Market Definition
- 1.2 Scope of the Study
2 RESEARCH METHODOLOGY
3 EXECUTIVE SUMMARY
4 MARKET LANDSCAPE
- 4.1 Market Overview
- 4.2 Market Drivers
- 4.2.1 Escalating Chronic-Disease Drug Demand
- 4.2.2 Biologics & Targeted-Therapy Pipeline Expansion
- 4.2.3 Outsourced Manufacturing Cost Advantages
- 4.2.4 Continuous-Flow & Mini-Plant Technologies Gain Traction
- 4.2.5 Government PLI/On-Shoring Incentives Reshape Clusters
- 4.2.6 AI-Enabled Retrosynthesis Cuts Development Cycles
- 4.3 Market Restraints
- 4.3.1 Rising Global GMP & Nitrosamine-Control Compliance Costs
- 4.3.2 Generic-Price Compression Squeezing API Margins
- 4.3.3 Supply-Chain Opacity Fueling Quality-Risk Perception
- 4.3.4 Complex Global Regulatory Harmonization for Biotech APIs
- 4.4 Industry Value Chain Analysis
- 4.5 Regulatory Landscape
- 4.6 Technological Outlook
- 4.7 Porter's Five Forces Analysis
- 4.7.1 Threat of New Entrants
- 4.7.2 Bargaining Power of Suppliers
- 4.7.3 Bargaining Power of Buyers
- 4.7.4 Threat of Substitutes
- 4.7.5 Competitive Rivalry
5 MARKET SIZE AND GROWTH FORECASTS (VALUE)
- 5.1 By API Type
- 5.1.1 Synthetic APIs
- 5.1.2 Biological APIs
- 5.1.3 Highly-Potent APIs (HPAPIs)
- 5.1.4 Natural / Phytochemical APIs
- 5.2 By Manufacturer Model
- 5.2.1 Captive / In-house
- 5.2.2 Merchant / Outsourced
- 5.3 By Molecule Size
- 5.3.1 Small Molecule
- 5.3.2 Large Molecule / Biologics
- 5.4 By Therapeutic Area
- 5.4.1 Oncology
- 5.4.2 Cardiovascular
- 5.4.3 Infectious Diseases
- 5.4.4 Metabolic Disorders
- 5.4.5 CNS & Neurology
- 5.4.6 Other Therapeutic Area
- 5.5 By Geography
- 5.5.1 North America
- 5.5.1.1 United States
- 5.5.1.2 Canada
- 5.5.1.3 Mexico
- 5.5.2 Europe
- 5.5.2.1 Germany
- 5.5.2.2 United Kingdom
- 5.5.2.3 France
- 5.5.2.4 Italy
- 5.5.2.5 Spain
- 5.5.2.6 Rest of Europe
- 5.5.3 Asia-Pacific
- 5.5.3.1 China
- 5.5.3.2 Japan
- 5.5.3.3 India
- 5.5.3.4 Australia
- 5.5.3.5 South Korea
- 5.5.3.6 Rest of Asia-Pacific
- 5.5.4 Middle East & Africa
- 5.5.4.1 GCC
- 5.5.4.2 South Africa
- 5.5.4.3 Rest of Middle East & Africa
- 5.5.5 South America
- 5.5.5.1 Brazil
- 5.5.5.2 Argentina
- 5.5.5.3 Rest of South America
- 5.5.1 North America
6 COMPETITIVE LANDSCAPE
- 6.1 Market Concentration
- 6.2 Strategic Moves
- 6.3 Market Share Analysis
- 6.4 Company Profiles (includes Global level Overview, Market level overview, Core Segments, Financials as available, Strategic Information, Market Rank/Share for key companies, Products and Services, and Recent Developments)
- 6.4.1 AbbVie Inc.
- 6.4.2 Aurobindo Pharma
- 6.4.3 BASF SE
- 6.4.4 Boehringer Ingelheim
- 6.4.5 Cambrex Corporation
- 6.4.6 Catalent Inc.
- 6.4.7 Cipla
- 6.4.8 Dr. Reddy's Laboratories
- 6.4.9 GSK plc
- 6.4.10 Lonza Group
- 6.4.11 Merck KGaA
- 6.4.12 Novartis International AG
- 6.4.13 Pfizer CentreOne
- 6.4.14 Piramal Pharma Solutions
- 6.4.15 Recipharm AB
- 6.4.16 Samsung Biologics
- 6.4.17 Siegfried AG
- 6.4.18 Sun Pharmaceutical Industries
- 6.4.19 Teva Pharmaceutical Industries
- 6.4.20 WuXi AppTec
7 MARKET OPPORTUNITIES AND FUTURE OUTLOOK
- 7.1 White-Space and Unmet-Need Assessment

