PUBLISHER: Mordor Intelligence | PRODUCT CODE: 2187293

PUBLISHER: Mordor Intelligence | PRODUCT CODE: 2187293
Fiber Optic Cable - Market Share Analysis, Industry Trends & Statistics, Growth Forecasts (2027 - 2032)
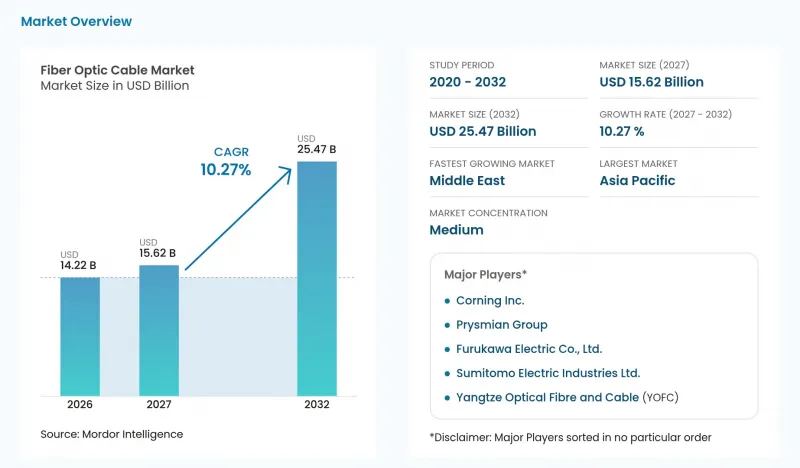
According to Mordor Intelligence, the fiber optic cable market size is expected to increase from USD 14.22 billion in 2026 to USD 15.62 billion in 2027 and reach USD 25.47 billion by 2032, growing at a CAGR of 10.27% over 2027-2032.
Global Fiber Optic Cable Market Trends and Insights
Increasing Penetration of High-Speed Internet and Global Data-Traffic Surge
A broader connected population expands the addressable need for networks, while rising traffic increases the capacity those networks must accommodate. The International Telecommunication Union estimated that 74% of the world's population, or 6 billion people, used the internet in 2025, up from 71% and 5.8 billion in 2024. Global fixed broadband traffic rose from 6.2 ZB in 2024 to 7.3 ZB in 2025, the organization estimated, highlighting the growing data-transport requirements supporting the fiber optic cable market. These measures distinguish growth in the connected population from growth in the traffic that networks carry, both of which influence the fiber optic cable market size needed to support network expansion. An operator planning only around new users would leave traffic-led capacity demand out of its expansion case.
Accelerated 5G Roll-outs and Fiber-Deep FTTx Deployments
Fixed access builds and mobile-network transport are shaping fiber optic cable market trends, creating separate routes from operator investment to fiber infrastructure demand. At the end of 2025, global 5G connections exceeded 2.7 billion, according to GSMA Intelligence. On May 26, 2025, U Mobile appointed Telekom Malaysia to provide leased fiber backhaul for its nationwide next-generation 5G rollout in Malaysia. Proximus's deployment reached 2.6 million fiber-to-the-home (FTTH) premises passed in Belgium at end-2025, representing around 42% population coverage. The Belgian footprint illustrates access-network scale, while the Malaysian appointment identifies fiber transport as part of mobile-network deployment. With leased backhaul, a mobile operator's 5G rollout can create fiber demand through its transport provider as well as through direct cable procurement.
High Civil-Works Cost and Right-of-Way Complexities
Route access can hold up a fiber build before cable installation begins, adding a timing constraint alongside deployment affordability. In a 2025 U.S. survey by NTCA, the Rural Broadband Association, 84.6% of respondent companies identified deployment cost as a significant barrier to widespread fiber deployment. In comments filed November 18, 2025, Crown Castle Fiber LLC reported an average 9-month wait for Los Angeles Department of Transportation permits for underground fiber facilities. These exposures affect different project decisions in the fiber optic cable market, with cost determining affordability and authorization determining when construction can proceed. Even where an operator is prepared to fund the build, route approval can defer the point at which the fiber earns revenue.
Other drivers and restraints analyzed in the detailed report include:
- Expanding Hyperscale Data-Center Interconnect Demand
- Government-Backed Rural Broadband and Digital-Inclusion Programs
- Price Volatility in Raw Materials and Helium Supply Constraints
For complete list of drivers and restraints, kindly check the Table Of Contents.
Segment Analysis
Armored cable accounted for a 34.03% share of the fiber optic cable market size in 2026, making it the largest segment. Armored construction adds a protective layer around the fibers for underground routes exposed to crushing or impact. For the network operator, a damaged cable threatens the connection that the buried route was built to provide. The specification decision concerns whether that exposure warrants protection, rather than whether more fibers would add transmission capacity.
Ribbon cable is the fastest-growing segment, with a forecast CAGR of 10.98% over 2027-2032. In September 2026, Verizon and Corning reached a supply agreement for high-density optical fiber and connectivity solutions for delivery during 2027-2032. Verizon identified Corning's Contour Flow flexible ribbon cable as a way to put more fiber within conduit pathways and increase network capacity, supporting demand for specialized solutions in the cable assembly market. Using more of an existing conduit gives an operator an alternative to enlarging the physical pathway, so cable density can influence the sequence of network expansion decisions.
Single-mode fiber represented a 72.43% fiber optic cable market share in 2026, making it the largest segment. EXA Infrastructure completed a European route deployment in 2025 that included 1,085 kilometers of new G.652D single-mode terrestrial fiber. The route connected London with Frankfurt, Amsterdam and Brussels. Because the 1,085-kilometer terrestrial section made up most of the 1,200-kilometer route, one corridor build placed a large single-mode fiber requirement with a single operator.
Multi-mode fiber is the fastest-growing segment, with a forecast CAGR of 10.6% over 2027-2032. CRU's January 2025 outlook forecast significant multi-mode fiber cable consumption growth across regions in data-center and generative AI applications. By July 2025, IEEE 802.3 reported adoption of Ethernet standards for links combining multi-mode cable and vertical-cavity surface-emitting laser transceivers in AI back-end and server-attachment networks. The group attributed adoption to these links' lower power and cost than other optical technologies and longer reach than copper. The buyer case rests on the economics and reach of the complete Ethernet link, so cable-only capacity comparisons miss part of multi-mode's appeal.
Complete Report Scope:
- By Cable Type
- Armored Cable
- Non-Armored Cable
- Ribbon Cable
- Other Cable Type
- By Fiber Mode
- Single-Mode Fiber
- Multi-Mode Fiber
- Plastic Optical Fiber
- By Installation Type
- Aerial / Overhead
- Underground / Buried
- Submarine / Under-Water
- Indoor / Drop Cables
- By End-User Industry
- Telecommunications
- Data Centers and Cloud Providers
- Power Utilities and Smart Grid
- Defense and Aerospace
- Industrial Automation and Control
- Healthcare and Medical
- Oil and Gas and Offshore
- Other End-User Industry
- By Geography
- North America
- United States
- Canada
- Mexico
- South America
- Brazil
- Argentina
- Rest of South America
- Europe
- Germany
- United Kingdom
- France
- Italy
- Spain
- Rest of Europe
- Asia Pacific
- China
- Japan
- India
- South Korea
- Rest of Asia Pacific
- Middle East
- Saudi Arabia
- United Arab Emirates
- Turkey
- Rest of Middle East
- Africa
- South Africa
- Nigeria
- Egypt
- Rest of Africa
- North America
Geography Analysis
Asia Pacific held a 36.12% fiber optic cable market share in 2026, making it the largest geography. China built 2.11 million kilometers of new optical cable lines in 2025, providing a substantial example of physical network expansion. For FY2025, TelkomGroup reported a groupwide fiber-optic backbone exceeding 210,000 kilometers as part of its B2B Infrastructure business and said it was accelerating Indonesia's national digital-infrastructure buildout. China's new-line construction represents route-build volume, while TelkomGroup's extensive backbone provides an operator base that suppliers can serve through upgrades and extensions.
The Middle East is the fastest-growing geography, with a forecast CAGR of 11.5% over 2027-2032. In 2025, du and Omantel activated the 275-kilometer Oman Emirates Gateway submarine fiber-optic cable between the United Arab Emirates and Oman. The system connects datamena DX1 in Dubai with Equinix MC1 in Barka and Equinix SN1 in Salalah. For Equinix MC1, Equinix SN1 and datamena DX1, the 275-kilometer route shows how cable demand arises from joining specific facilities into a cross-border network.
In North America, the FCC's June 2026 proposed rulemaking described some US state and local wireline-authorization reviews taking months or years, delaying deployments. At an April 29, 2026, congressional hearing, Anatel's substitute counselor reported fiber-optic backhaul installed in 4,645 Brazilian municipalities, while Peru's fiber-based fixed-internet connections expanded in 2025. Europe's Connecting Europe Broadband Fund had passed one million underserved rural and semi-rural premises with fiber broadband by June 2025. South Africa's fiber-to-the-home/building subscriptions grew 22% in 2025 as DSL subscriptions declined 6%, while Kenya's ongoing Universal Broadband Connectivity project reported 676 kilometers of fiber installed by October 16, 2026 and marked its target underachieved. US permit reviews delay deployments, while Kenya's installed length fell short of its project target and European access programs and subscriber migration in Peru and South Africa support fiber demand.
- Prysmian Group
- Corning Inc.
- Sumitomo Electric Industries Ltd.
- Furukawa Electric Co., Ltd.
- Yangtze Optical Fibre and Cable (YOFC)
- CommScope Technologies LLC
- Fujikura Ltd.
- Nexans S.A.
- LS Cable & System Ltd.
- Lightera, LLC
- Sterlite Technologies Ltd.
- Hengtong Optic-Electric Co., Ltd.
- ZTT Group
- Proterial Ltd.
- Finolex Cables Ltd.
- Belden Inc.
- General Cable Corp.
- Hexatronic Group AB
- HMN Tech Co., Ltd.
- Taihan Fiberoptics Co., Ltd.
Additional Benefits:
- The market estimate (ME) sheet in Excel format
- 3 months of analyst support
TABLE OF CONTENTS
1 INTRODUCTION
- 1.1 Study Assumptions and Market Definition
- 1.2 Scope of the Study
2 RESEARCH METHODOLOGY
3 EXECUTIVE SUMMARY
4 MARKET LANDSCAPE
- 4.1 Market Overview
- 4.2 Market Drivers
- 4.2.1 Increasing Penetration of High-Speed Internet and Global Data-Traffic Surge
- 4.2.2 Accelerated 5G Roll-outs and Fiber-Deep FTTx Deployments
- 4.2.3 Expanding Hyperscale Data-Center Interconnect Demand
- 4.2.4 Government-Backed Rural Broadband and Digital-Inclusion Programs
- 4.2.5 Sub-Sea Route Diversification for Geopolitical Resiliency
- 4.2.6 Sustainability Push Replacing Copper with Low-Carbon Glass Fiber
- 4.3 Market Restraints
- 4.3.1 High Civil-Works Cost and Right-of-Way Complexities
- 4.3.2 Price Volatility in Raw Materials and Helium Supply Constraints
- 4.3.3 Delays in Environmental Permitting for Submarine Routes
- 4.3.4 Plateauing Telco Capex in Saturated Metro Markets
- 4.4 Industry Value Chain Analysis
- 4.5 Regulatory Landscape
- 4.6 Technological Outlook
- 4.7 Porter's Five Forces Analysis
- 4.7.1 Threat of New Entrants
- 4.7.2 Bargaining Power of Suppliers
- 4.7.3 Bargaining Power of Buyers
- 4.7.4 Threat of Substitutes
- 4.7.5 Competitive Rivalry
- 4.8 Pricing Analysis
- 4.9 Impact of Macroeconomic Factors on the Market
- 4.10 Investment Analysis
5 MARKET SIZE AND GROWTH FORECASTS (VALUE)
- 5.1 By Cable Type
- 5.1.1 Armored Cable
- 5.1.2 Non-Armored Cable
- 5.1.3 Ribbon Cable
- 5.1.4 Other Cable Type
- 5.2 By Fiber Mode
- 5.2.1 Single-Mode Fiber
- 5.2.2 Multi-Mode Fiber
- 5.2.3 Plastic Optical Fiber
- 5.3 By Installation Type
- 5.3.1 Aerial / Overhead
- 5.3.2 Underground / Buried
- 5.3.3 Submarine / Under-Water
- 5.3.4 Indoor / Drop Cables
- 5.4 By End-User Industry
- 5.4.1 Telecommunications
- 5.4.2 Data Centers and Cloud Providers
- 5.4.3 Power Utilities and Smart Grid
- 5.4.4 Defense and Aerospace
- 5.4.5 Industrial Automation and Control
- 5.4.6 Healthcare and Medical
- 5.4.7 Oil and Gas and Offshore
- 5.4.8 Other End-User Industry
- 5.5 By Geography
- 5.5.1 North America
- 5.5.1.1 United States
- 5.5.1.2 Canada
- 5.5.1.3 Mexico
- 5.5.2 South America
- 5.5.2.1 Brazil
- 5.5.2.2 Argentina
- 5.5.2.3 Rest of South America
- 5.5.3 Europe
- 5.5.3.1 Germany
- 5.5.3.2 United Kingdom
- 5.5.3.3 France
- 5.5.3.4 Italy
- 5.5.3.5 Spain
- 5.5.3.6 Rest of Europe
- 5.5.4 Asia Pacific
- 5.5.4.1 China
- 5.5.4.2 Japan
- 5.5.4.3 India
- 5.5.4.4 South Korea
- 5.5.4.5 Rest of Asia Pacific
- 5.5.5 Middle East
- 5.5.5.1 Saudi Arabia
- 5.5.5.2 United Arab Emirates
- 5.5.5.3 Turkey
- 5.5.5.4 Rest of Middle East
- 5.5.6 Africa
- 5.5.6.1 South Africa
- 5.5.6.2 Nigeria
- 5.5.6.3 Egypt
- 5.5.6.4 Rest of Africa
- 5.5.1 North America
6 COMPETITIVE LANDSCAPE
- 6.1 Market Concentration
- 6.2 Strategic Moves
- 6.3 Market Share Analysis
- 6.4 Company Profiles (includes Global level Overview, Market level overview, Core Segments, Financials as available, Strategic Information, Market Rank/Share for key companies, Products and Services, and Recent Developments)
- 6.4.1 Prysmian Group
- 6.4.2 Corning Inc.
- 6.4.3 Sumitomo Electric Industries Ltd.
- 6.4.4 Furukawa Electric Co., Ltd.
- 6.4.5 Yangtze Optical Fibre and Cable (YOFC)
- 6.4.6 CommScope Technologies LLC
- 6.4.7 Fujikura Ltd.
- 6.4.8 Nexans S.A.
- 6.4.9 LS Cable & System Ltd.
- 6.4.10 Lightera, LLC
- 6.4.11 Sterlite Technologies Ltd.
- 6.4.12 Hengtong Optic-Electric Co., Ltd.
- 6.4.13 ZTT Group
- 6.4.14 Proterial Ltd.
- 6.4.15 Finolex Cables Ltd.
- 6.4.16 Belden Inc.
- 6.4.17 General Cable Corp.
- 6.4.18 Hexatronic Group AB
- 6.4.19 HMN Tech Co., Ltd.
- 6.4.20 Taihan Fiberoptics Co., Ltd.
7 MARKET OPPORTUNITIES AND FUTURE OUTLOOK
- 7.1 White-Space and Unmet-Need Assessment

