PUBLISHER: Mordor Intelligence | PRODUCT CODE: 2187315

PUBLISHER: Mordor Intelligence | PRODUCT CODE: 2187315
Silica Sand - Market Share Analysis, Industry Trends & Statistics, Growth Forecasts (2027 - 2032)
According to Mordor Intelligence, the silica sand market size was valued at USD 26.33 billion in 2026 and estimated to grow from USD 27.8 billion in 2027 to reach USD 36.51 billion by 2032, at a CAGR of 5.6% during the forecast period (2027-2032).
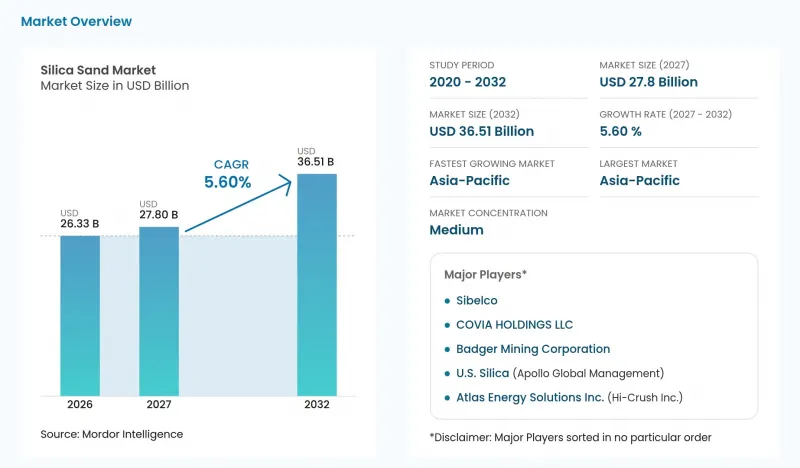
The market volume was 391.6 million tons in 2026 and estimated to grow from 411.2 million tons in 2027 to reach 524.8 million tons by 2032, at a CAGR of 5% during the forecast period (2027-2032). This report is segmented by Purity Level (Standard, High-Purity, and more), End-user Industry (Oil and Gas, Other End-user Industries, and more), and Geography (Asia-Pacific, Europe, and more). The market forecasts are provided in terms of value (USD) and volume (tons), based on availability.
Global Silica Sand Market Trends and Insights
Rising demand for premium-clarity flat and solar glass
Commissioned solar-module capacity strengthens the connection between renewable-energy expansion and demand for glass-making inputs. Xinyi Solar reported that rising demand in the United States and India primarily drove growth in its overseas solar-glass sales in 2025, after new module capacity was commissioned there. Around 690 GW of photovoltaic capacity was installed globally in 2025, 15% more than in 2024. Module manufacturing links this expansion to glass production, creating an outlet for the silica supplied to glass manufacturers. Solar-glass suppliers can identify demand locations more directly from commissioned module lines in India and the United States than from global installation growth alone.
Surging frac-sand intensity per shale well
Sand use per completed well can support supplier demand even when drilling and completion activity weakens. Smart Sand's 2025 filing reported that longer laterals and increased sand volume per lateral foot supported relatively stable frac-sand demand despite lower activity. The filing cited Spears & Associates data showing that North American proppant demand nevertheless fell about 2% from 2024. Greater material intensity therefore cushioned the activity decline without eliminating the wider demand pressure, separating this driver from an expansion in well counts. Higher intensity offers suppliers more material per completion, while the 2025 decline in drilling and completion activity limited the number of such sales opportunities.
Escalating environmental permitting hurdles
Environmental licensing can prevent a producer from converting contracted demand into deliverable silica supply. Manitoba received Sio Silica's additional technical and public-comment responses on September 17, 2026, and was reviewing them on September 24, with further information requests possible. On September 15, 2026, Sio agreed to sell a California-based purchaser 300,000 metric tons annually of SiMbA high-purity quartz silica for 5 years from 2028, subject to a Manitoba extraction license and other customary terms. That condition makes approved extraction a prerequisite for supplying the contracted outlet. Approval timing therefore governs when the agreement can become physical supply, leaving revenue dependent on a regulatory decision after the buyer agreement.
Other drivers and restraints analyzed in the detailed report include:
- Growth in high-purity silica for semiconductor fabs
- Infrastructure stimulus-led concrete consumption
- Rapid substitution by recycled cullet in container glass
For complete list of drivers and restraints, kindly check the Table Of Contents.
Segment Analysis
Standard (95 to 99.5%) accounted for a 47.46% share of the silica sand market size in 2026, making it the largest segment. Horizon Minetech Private Limited reports a 98.5% SiO2 silica-sand grade and, separately, dispatch capacity of 25,000 metric tons per month for its operation. Its activities span mining, washing, drying, grading, storage, and dispatch in India. For buyers whose specifications accept 98.5% SiO2, that grade and dispatch capacity show Standard-band supply organized for regular bulk dispatch.
High-purity sand with more than 99.5% SiO2 is forecast to be the fastest-growing segment, at a 6.7% CAGR during 2027-2032. USGS linked increased global silicon-ingot manufacturing to higher recent demand for high-purity quartz used in fused-quartz crucibles. Sibelco grew semiconductor-market high-purity quartz sales in H1 2026, supported by AI, 5G, and electric vehicle technologies. Its solar PV high-purity quartz sales declined in that period, primarily because of solar supply-chain challenges rather than underlying solar adoption. High-purity suppliers therefore face divergent application conditions within the same material category, with semiconductor customers providing the stronger reported sales pathway during that period.
Complete Report Scope:
- By Purity Level
- High-Purity (more than 99.5% SiO2)
- Standard (95 to 99.5%)
- Low-Purity (less than 95%)
- By End-user Industry
- Glass Manufacturing
- Foundry
- Chemical Production
- Construction
- Paints and Coatings
- Ceramics and Refractories
- Filtration
- Oil and Gas
- Other End-user Industries
- By Geography
- Asia-Pacific
- China
- India
- Japan
- South Korea
- Indonesia
- Australia
- Rest of Asia-Pacific
- North America
- United States
- Canada
- Mexico
- Europe
- Germany
- United Kingdom
- Italy
- France
- Russia
- Rest of Europe
- South America
- Brazil
- Argentina
- Rest of South America
- Middle-East and Africa
- Saudi Arabia
- United Arab Emirates
- South Africa
- Rest of Middle-East and Africa
- Asia-Pacific
Geography Analysis
Asia-Pacific accounted for a 40.68% share of the silica sand market size in 2026 and is forecast to grow at a 6.8% CAGR during 2027-2032. China imported 4.89 million metric tons of silica sands and quartz sands in 2025. China's industrial enterprises above designated size produced 3.16 billion square meters of ultra-clear solar glass in 2025, up 3.4% from 2024. Large import flows provide an outlet for external suppliers, while expanding glass production identifies a downstream application for silica inputs.
In North America, glassmaking used 7% of U.S. industrial sand and gravel tonnage in 2025. This creates a distinct glassmaking outlet within the country's wider industrial-sand use profile, giving suppliers serving glass customers a specific channel to address. In Europe, FEVE members' food-and-beverage container-glass production grew 2% by tonnage and units in 2025, reaching 20.3 million metric tons and 73.3 billion units. The 2% increase in both tonnage and units indicates more containers as well as greater weight, placing FEVE members' packaging glass among Europe's expanding sand-consuming applications.
South America's supply base includes Brazil's Mineracao Jundu, which produces resin-coated sands at Descalvado, Sao Paulo, for foundry and oil-and-gas applications. In Chile, Minera Toro extracts and processes silica-bearing sand at Planta Flora for glass-container manufacturing. Jundu's resin-coated sands result from an added drying and synthetic-resin processing step on industrial quartz sand, with oil-and-gas applications particularly involving well fracturing. In Middle-East and Africa, Saudi Arabian glass-manufacturing demand rose over the 3 years preceding a 2026 prospectus, alongside greater architectural use of tempered, laminated, and insulated glass. The prospectus ties that Saudi demand to rapid urbanization and large-scale infrastructure projects, so building-sector glass is the reported outlet there.
- Atlas Energy Solutions Inc. (Hi-Crush Inc.)
- Badger Mining Corporation
- Chongqing Changjiang River Moulding Material Group Co. Ltd
- COVIA HOLDINGS LLC
- Euroquarz GmbH
- Gulf Coast Sand
- JFE Mineral & Alloy Company Ltd
- Mitsubishi Corporation
- PUM GROUP
- Sibelco
- Sil Industrial Minerals
- Source Energy Services
- Superior Silica Sands
- TOCHU CORPORATION
- U.S. Silica (Apollo Global Management)
Additional Benefits:
- The market estimate (ME) sheet in Excel format
- 3 months of analyst support
TABLE OF CONTENTS
1 INTRODUCTION
- 1.1 Study Assumptions and Market Definition
- 1.2 Scope of the Study
2 RESEARCH METHODOLOGY
3 EXECUTIVE SUMMARY
4 MARKET LANDSCAPE
- 4.1 Market Overview
- 4.2 Market Drivers
- 4.2.1 Rising demand for premium-clarity flat and solar glass
- 4.2.2 Surging frac-sand intensity per shale well
- 4.2.3 Growth in high-purity silica for semiconductor fabs
- 4.2.4 Infrastructure stimulus-led concrete consumption
- 4.2.5 AI-driven foundry process optimization
- 4.3 Market Restraints
- 4.3.1 Escalating environmental permitting hurdles
- 4.3.2 Rapid substitution by recycled cullet in container glass
- 4.3.3 Emerging low-quartz proppants (ceramics, resin-coated)
- 4.4 Industry Value Chain Analysis
- 4.5 Regulatory Landscape
- 4.6 Technological Outlook
- 4.7 Porter's Five Forces Analysis
- 4.7.1 Threat of New Entrants
- 4.7.2 Bargaining Power of Suppliers
- 4.7.3 Bargaining Power of Buyers
- 4.7.4 Threat of Substitutes
- 4.7.5 Competitive Rivalry
5 MARKET SIZE AND GROWTH FORECASTS (VALUE AND VOLUME)
- 5.1 By Purity Level
- 5.1.1 High-Purity (more than 99.5% SiO2)
- 5.1.2 Standard (95 to 99.5%)
- 5.1.3 Low-Purity (less than 95%)
- 5.2 By End-user Industry
- 5.2.1 Glass Manufacturing
- 5.2.2 Foundry
- 5.2.3 Chemical Production
- 5.2.4 Construction
- 5.2.5 Paints and Coatings
- 5.2.6 Ceramics and Refractories
- 5.2.7 Filtration
- 5.2.8 Oil and Gas
- 5.2.9 Other End-user Industries
- 5.3 By Geography
- 5.3.1 Asia-Pacific
- 5.3.1.1 China
- 5.3.1.2 India
- 5.3.1.3 Japan
- 5.3.1.4 South Korea
- 5.3.1.5 Indonesia
- 5.3.1.6 Australia
- 5.3.1.7 Rest of Asia-Pacific
- 5.3.2 North America
- 5.3.2.1 United States
- 5.3.2.2 Canada
- 5.3.2.3 Mexico
- 5.3.3 Europe
- 5.3.3.1 Germany
- 5.3.3.2 United Kingdom
- 5.3.3.3 Italy
- 5.3.3.4 France
- 5.3.3.5 Russia
- 5.3.3.6 Rest of Europe
- 5.3.4 South America
- 5.3.4.1 Brazil
- 5.3.4.2 Argentina
- 5.3.4.3 Rest of South America
- 5.3.5 Middle-East and Africa
- 5.3.5.1 Saudi Arabia
- 5.3.5.2 United Arab Emirates
- 5.3.5.3 South Africa
- 5.3.5.4 Rest of Middle-East and Africa
- 5.3.1 Asia-Pacific
6 COMPETITIVE LANDSCAPE
- 6.1 Market Concentration
- 6.2 Strategic Moves
- 6.3 Market Share Analysis
- 6.4 Company Profiles (includes Global level Overview, Market level overview, Core Segments, Financials as available, Strategic Information, Market Rank/Share for key companies, Products and Services, and Recent Developments)
- 6.4.1 Atlas Energy Solutions Inc. (Hi-Crush Inc.)
- 6.4.2 Badger Mining Corporation
- 6.4.3 Chongqing Changjiang River Moulding Material Group Co. Ltd
- 6.4.4 COVIA HOLDINGS LLC
- 6.4.5 Euroquarz GmbH
- 6.4.6 Gulf Coast Sand
- 6.4.7 JFE Mineral & Alloy Company Ltd
- 6.4.8 Mitsubishi Corporation
- 6.4.9 PUM GROUP
- 6.4.10 Sibelco
- 6.4.11 Sil Industrial Minerals
- 6.4.12 Source Energy Services
- 6.4.13 Superior Silica Sands
- 6.4.14 TOCHU CORPORATION
- 6.4.15 U.S. Silica (Apollo Global Management)
7 MARKET OPPORTUNITIES AND FUTURE OUTLOOK
- 7.1 White-Space and Unmet-Need Assessment

