PUBLISHER: Mordor Intelligence | PRODUCT CODE: 2187328

PUBLISHER: Mordor Intelligence | PRODUCT CODE: 2187328
India Waste Management - Market Share Analysis, Industry Trends & Statistics, Growth Forecasts (2027 - 2032)
According to Mordor Intelligence, the India waste management market size is expected to increase from USD 14.29 billion in 2026 to USD 15.12 billion in 2027 and reach USD 20.33 billion by 2032, growing at a CAGR of 6.1% over 2027-2032.
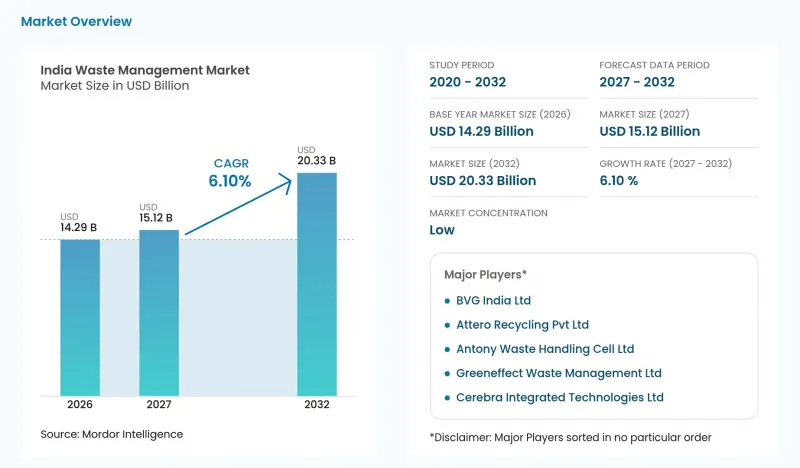
This report is segmented by Source (Residential, Commercial, and more), Service Type (Disposal / Treatment, Collection, Transportation, Sorting & Segregation, and more), Waste Type (Municipal Solid Waste, E-waste, and more), and Geography (West India, South India, and more). The market forecasts are provided in terms of value (USD), based on availability.
India Waste Management Market Trends and Insights
Enforcement of Plastic Waste Management (Amendment) Rules 2024 & single-use plastic ban
Enforcement gives plastic-waste handling a compliance dimension beyond the quantity collected. From July 2022 to July 2025, authorities across India conducted 861,740 inspections to enforce the ban on identified single-use plastic items and seized 1,985 metric tons of banned items. The 2024 amendment introduced annual local-body assessments by June 30, covering dumpsite plastic and 5-year generation estimates, alongside annual online reporting on waste, infrastructure, bylaws and ban enforcement. On October 9, 2026, Sikkim's pollution-control board, local-body authorities and police inspected shops and commercial establishments in 4 municipal zones, finding no violations and making no seizures. For service suppliers, the assessment duties create an opening to combine handling with records supporting local-body reports. Recurring reporting provides a service-demand mechanism even when an inspection produces no seized material.
National Circular Economy Framework 2025 proposes industry recycling targets
Proposed recycling goals favor linked recovery services when their delivery depends on more than installing processing equipment. The Confederation of Indian Industry's National Circular Economy Framework, Edition 3, proposes an 85% recycling rate for India's municipal solid waste dry fraction by 2030. The framework says effective recycling requires collection, segregation, sorting and processing systems, with material recovery depending on organized supply chains and advanced facilities. For operators, this makes the connection between collected dry waste and processing capability central to the prospective opportunity. CII's November 2025 baseline put recovery at slightly over 50% of India's dry waste streams, equating to roughly 19% of municipal solid waste, leaving substantial recovery work to reach the proposed dry-fraction target.
Source-segregation gaps persist in urban wards in 2025
Mixed material can turn a collection success into a processing cost for municipal waste contractors. By January 2026, 90% of wards in India's statutory towns had achieved 100% source segregation, leaving the remaining wards short of full segregation. A 2025 World Bank and Asian Development Bank city diagnostic linked limited segregation to additional separation steps, greater equipment wear and lower resale value of sorted material. For a processor, this combination can weaken the economics of expansion even where collected waste is available. A treatment contract priced only around tonnage would leave the processor exposed to differences in incoming material quality.
Other drivers and restraints analyzed in the detailed report include:
- Battery Waste Management Rules, 2022 create EPR demand for end-of-life Li-ion recycling
- 15th Finance Commission grants support ULB spending on SWM in 2025-26
- NIMBY litigation challenges planned WtE capacity
For complete list of drivers and restraints, kindly check the Table Of Contents.
Segment Analysis
Residential accounted for a 48.36% share of the India waste management market size in 2026. Chandigarh Municipal Corporation reported door-to-door waste collection for 240,000 households in November 2025, describing this as 100% of Chandigarh households. A seven-day survey of 215 households in Ujjain found average daily generation of 651.4 g per household, so each connected home contributes a small daily waste stream. Residential's scale rests on aggregating such household streams across municipal collection networks, with Chandigarh's reported coverage illustrating the number of service relationships these networks can support.
Commercial waste is the fastest-growing segment, with a forecast CAGR of 8.2% over 2027-2032. India's Solid Waste Management Rules, 2026, effective April 1, cover commercial bulk generators meeting at least one threshold of 20,000 square meters floor area, 40,000 liters daily water use or 100 kilograms daily waste. Qualifying generators must obtain local-body certificates for dry-waste collection and transportation to registered processing facilities. Because eligibility can arise from premises size or water use, the commercial service base is defined by more than the quantity of waste a business hands over. That favors providers able to serve large qualifying accounts with a connected collection-to-processing offer, while the local body retains the certificate-issuing role.
Complete Report Scope:
- By Source
- Residential
- Commercial (retail, office, etc.)
- Industrial
- Medical (Health and Pharmaceutical)
- Construction & Demolition
- Others (institutional, agricultural, etc)
- By Service Type
- Collection, Transportation, Sorting & Segregation
- Disposal / Treatment
- Landfill
- Recycling & Resource Recovery
- Incineration & Waste-to-Energy
- Others (Chemical Treatment, Composting, etc.)
- Others (Consulting, Audit & Training, etc.)
- By Waste Type
- Municipal Solid Waste
- Industrial Hazardous Waste
- E-waste
- Plastic Waste
- Biomedical Waste
- Construction & Demolition Waste
- Agricultural Waste
- Other Specialized Waste (radioactive, etc)
- By Geography
- North India
- South India
- West India
- East India
- Central India
List of Companies Covered in this Report:
- Greeneffect Waste Management Ltd
- Antony Waste Handling Cell Ltd
- Attero Recycling Pvt Ltd
- BVG India Ltd
- Cerebra Integrated Technologies Ltd
- Ecogreen Energy Pvt Ltd
- Ecowise Waste Management Pvt Ltd
- Exigo Recycling Pvt Ltd
- Hanjer Biotech Energies Pvt Ltd
- Hydroair Tectonics (PCD) Ltd
- Indo Enviro Integrated Solutions Pvt Ltd
- JITF Urban Infrastructure Ltd
- NEPRA Resource Management Pvt Ltd
- Re Sustainability Ltd
- Recykal (Rapidue Technologies)
- Saahas Zero Waste
- Spak Green Enviro Pvt Ltd
- Tatva Global Environment Pvt Ltd
- Waste Ventures India Pvt Ltd
- Zonta Infratech Pvt Ltd
Additional Benefits:
- The market estimate (ME) sheet in Excel format
- 3 months of analyst support
TABLE OF CONTENTS
1 INTRODUCTION
- 1.1 Study Assumptions and Market Definition
- 1.2 Scope of the Study
2 RESEARCH METHODOLOGY
3 EXECUTIVE SUMMARY
4 MARKET LANDSCAPE
- 4.1 Market Overview
- 4.2 Market Drivers
- 4.2.1 Enforcement of Plastic Waste Management (Amendment) Rules 2024 & single-use plastic ban
- 4.2.2 National Circular Economy Framework 2025 proposes industry recycling targets
- 4.2.3 Battery Waste Management Rules, 2022 create EPR demand for end-of-life Li-ion recycling
- 4.2.4 15th Finance Commission grants support ULB spending on SWM in 2025-26
- 4.2.5 Agri-biomass-to-bioCNG subsidies linked to SATAT spur rural organic-waste valorization
- 4.2.6 Zero-waste commitments from hyperscale data-centers drive recycling contracts
- 4.3 Market Restraints
- 4.3.1 Source-segregation gaps persist in urban wards in 2025
- 4.3.2 NIMBY litigation challenges planned WtE capacity
- 4.3.3 Carbon-credit price slump (Less than ₹ 600/tCO2e) erodes RDF co-processing revenues
- 4.3.4 Ammonia-rich mixed food waste corrodes AD plants, raising O&M more than 15 %
- 4.4 Industry Value Chain Analysis
- 4.5 Regulatory Landscape
- 4.6 Technological Outlook
- 4.7 Porter's Five Forces Analysis
- 4.7.1 Threat of New Entrants
- 4.7.2 Bargaining Power of Suppliers
- 4.7.3 Bargaining Power of Buyers
- 4.7.4 Threat of Substitutes
- 4.7.5 Competitive Rivalry
- 4.8 Logistics Infrastructure & Development Analysis
- 4.9 Investment & Funding Analysis
5 MARKET SIZE AND GROWTH FORECASTS (VALUE)
- 5.1 By Source
- 5.1.1 Residential
- 5.1.2 Commercial (retail, office, etc.)
- 5.1.3 Industrial
- 5.1.4 Medical (Health and Pharmaceutical)
- 5.1.5 Construction & Demolition
- 5.1.6 Others (institutional, agricultural, etc)
- 5.2 By Service Type
- 5.2.1 Collection, Transportation, Sorting & Segregation
- 5.2.2 Disposal / Treatment
- 5.2.2.1 Landfill
- 5.2.2.2 Recycling & Resource Recovery
- 5.2.2.3 Incineration & Waste-to-Energy
- 5.2.2.4 Others (Chemical Treatment, Composting, etc.)
- 5.2.3 Others (Consulting, Audit & Training, etc.)
- 5.3 By Waste Type
- 5.3.1 Municipal Solid Waste
- 5.3.2 Industrial Hazardous Waste
- 5.3.3 E-waste
- 5.3.4 Plastic Waste
- 5.3.5 Biomedical Waste
- 5.3.6 Construction & Demolition Waste
- 5.3.7 Agricultural Waste
- 5.3.8 Other Specialized Waste (radioactive, etc)
- 5.4 By Geography
- 5.4.1 North India
- 5.4.2 South India
- 5.4.3 West India
- 5.4.4 East India
- 5.4.5 Central India
6 COMPETITIVE LANDSCAPE
- 6.1 Market Concentration
- 6.2 Strategic Moves
- 6.3 Market Share Analysis
- 6.4 Company Profiles (includes Global level Overview, Market level overview, Core Segments, Financials as available, Strategic Information, Market Rank/Share for key companies, Products and Services, and Recent Developments)
- 6.4.1 Greeneffect Waste Management Ltd
- 6.4.2 Antony Waste Handling Cell Ltd
- 6.4.3 Attero Recycling Pvt Ltd
- 6.4.4 BVG India Ltd
- 6.4.5 Cerebra Integrated Technologies Ltd
- 6.4.6 Ecogreen Energy Pvt Ltd
- 6.4.7 Ecowise Waste Management Pvt Ltd
- 6.4.8 Exigo Recycling Pvt Ltd
- 6.4.9 Hanjer Biotech Energies Pvt Ltd
- 6.4.10 Hydroair Tectonics (PCD) Ltd
- 6.4.11 Indo Enviro Integrated Solutions Pvt Ltd
- 6.4.12 JITF Urban Infrastructure Ltd
- 6.4.13 NEPRA Resource Management Pvt Ltd
- 6.4.14 Re Sustainability Ltd
- 6.4.15 Recykal (Rapidue Technologies)
- 6.4.16 Saahas Zero Waste
- 6.4.17 Spak Green Enviro Pvt Ltd
- 6.4.18 Tatva Global Environment Pvt Ltd
- 6.4.19 Waste Ventures India Pvt Ltd
- 6.4.20 Zonta Infratech Pvt Ltd
7 MARKET OPPORTUNITIES AND FUTURE OUTLOOK
- 7.1 White-Space and Unmet-Need Assessment

