PUBLISHER: Mordor Intelligence | PRODUCT CODE: 2187413

PUBLISHER: Mordor Intelligence | PRODUCT CODE: 2187413
Optical Transceiver - Market Share Analysis, Industry Trends & Statistics, Growth Forecasts (2027 - 2032)
According to Mordor Intelligence, the optical transceiver market size is projected to expand from USD 15.42 billion in 2026 and USD 17.53 billion in 2027 to USD 33.93 billion by 2032, registering a CAGR of 14.12% between 2027 and 2032.
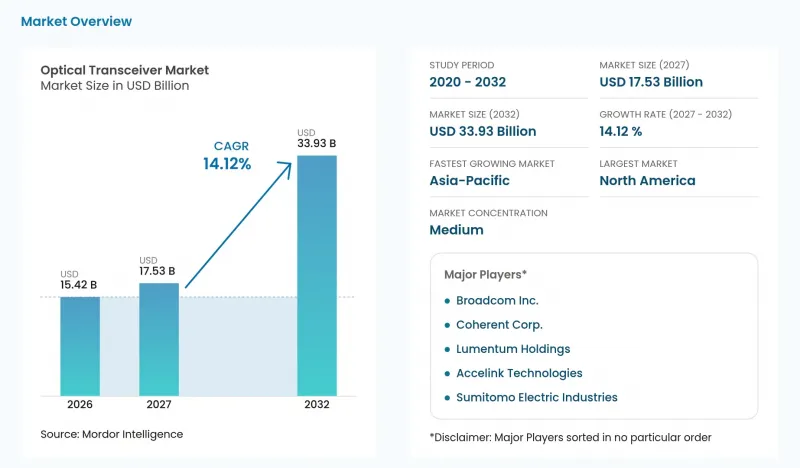
This report is segmented by Protocol (Ethernet and more), Data Rate (100 - 400 Gbps and more), Form Factor (QSFP28 / QSFP-DD and more), Fiber Type (Single-Mode and more), Reach Distance (Short-Reach and more), Application (Data Centers and more), and Geography (North America and more). The market forecasts are provided in terms of value (USD), based on availability.
Global Optical Transceiver Market Trends and Insights
Hyperscale Data-Center Expansion
Hyperscale expansion increases optical-link requirements when a single computing system spans several data-center buildings. In October 2026, Meta reported that its Prometheus supercluster in New Albany, Ohio, comprises hundreds of thousands of GPUs across fiber-connected data-center buildings. Meta described those interconnected buildings as functioning as a single machine. That architecture makes communication between buildings part of the computing system itself, extending the commercial role of optics beyond connectivity within individual facilities. A larger computing footprint at one campus can generate optical demand between buildings, so cluster expansion can create additional links without requiring a separate data-center location.
5G Fronthaul and Backhaul Fiber Build-Out
Mobile-network expansion creates an optical transport opportunity when operators connect their 5G infrastructure through fiber. In 2025, stc group established 8,858 fiber backhaul connections for 5G sites in Saudi Arabia. This completed activity shows how investment in wireless service can generate a substantial fixed-network implementation requirement alongside the radio infrastructure. For transceiver suppliers, the relevant demand mechanism is the extension of optical connectivity into the mobile transport network. Each fiber backhaul connection links a 5G site to the operator network, so build-outs on this scale create optical endpoint demand at both ends of each link.
CAPEX Burden to Upgrade Legacy Fiber Plants
The cost of replacing legacy access infrastructure can limit optical endpoint expansion even when the network upgrade offers operating benefits. Connect Europe reports that European cable operators' self-overbuilding of legacy hybrid fiber-coax (HFC) plant with fiber-to-the-home (FTTH) is more capital-intensive than upgrading HFC technologies. The association divides cable operators between FTTH overbuilding and HFC upgrades using DOCSIS 3.1 or DOCSIS 4.0. Operators choosing the latter route can retain coaxial access instead of extending fiber to each premise. Higher overbuild costs can therefore hold back fiber-based module volumes in European cable networks by favoring upgrades that require fewer new fiber endpoints.
Other drivers and restraints analyzed in the detailed report include:
- Migration to 400G and 800G Ethernet
- Growing Cloud AI / ML Clusters Adopting CPO
- Laser-Diode and DSP Supply Constraints
For complete list of drivers and restraints, kindly check the Table Of Contents.
Segment Analysis
Ethernet accounted for a 45.96% share of the optical transceiver market size in 2026. In October 2026, Meta described operating building-level Ethernet fabrics at its Prometheus supercluster in New Albany, Ohio, with each fabric interconnecting up to 20,736 GPUs. Those building-level fabrics use a high-bandwidth, low-latency multilayer topology to provide connectivity across the accelerator population within the computing building. Because each fabric ties these GPUs together through several switching layers, module vendors serve a network whose performance depends on the whole topology rather than on any single link.
CWDM / DWDM is forecast to be the fastest-growing segment, with a 15.33% CAGR from 2027 to 2032. RETN completed a 2025 deployment of hundreds of 400G coherent pluggables on 300-to-950-kilometer links across its Pan-Eurasian backbone using IP-over-DWDM. That application places coherent-module capability inside a wavelength-based transport architecture, connecting the opportunity with an operator's capacity requirements across long-haul routes. Backbone operators can make coherent pluggables a recurring unit of long-haul capacity expansion, extending module suppliers' addressable demand beyond local computing links.
The 100 to 400 Gbps segment represented a 39.44% optical transceiver market share in 2026. In May 2025, Poland's EXATEL said it was deploying Ciena's 400G ZR+ coherent pluggable transceivers across multiple router vendors over an open photonic line system. With modules deployable across router vendors, EXATEL's design allows optical capacity to be added without making the transceiver choice depend on one router platform.
The greater-than-400 Gbps segment is forecast to be the fastest-growing segment, with a 15.1% CAGR from 2027 to 2032. Applied Optoelectronics reported that its 800G product volume more than doubled from Q1 2026 to Q2 2026. In its second-quarter 2026 results, Applied Optoelectronics forecast demand for its 800G transceivers and 1.6 Tb products to outpace its production capacity through mid-2027. The forecast points to a producer-specific limit on near-term 800G supply, so access to production capacity matters alongside transmission specifications.
Complete Report Scope:
- By Protocol
- Ethernet
- InfiniBand
- Fibre Channel
- CWDM / DWDM
- FTTx / PON
- Other Protocols
- By Data Rate
- Less than 10 Gbps
- 10 - 40 Gbps
- 40 - 100 Gbps
- 100 - 400 Gbps
- Greater than 400 Gbps
- By Form Factor
- SFP / SFP+
- QSFP / QSFP+
- QSFP28 / QSFP-DD
- CFP / CFP2 / CFP4
- OSFP
- Other Form Factors
- By Fiber Type
- Single-Mode
- Multi-Mode
- By Reach Distance
- Short-Reach (Less than 10 km)
- Medium-Reach (10 - 40 km)
- Long-Reach (Greater than 40 km)
- By Application
- Data Centers
- Telecommunications
- Enterprise / Campus
- Industrial and Other Applications
- By Geography
- North America
- United States
- Canada
- Mexico
- Europe
- Germany
- United Kingdom
- France
- Russia
- Rest of Europe
- Asia-Pacific
- China
- Japan
- India
- South Korea
- Australia
- Rest of Asia-Pacific
- Middle East and Africa
- Middle East
- Saudi Arabia
- United Arab Emirates
- Rest of Middle East
- Africa
- South Africa
- Egypt
- Rest of Africa
- Middle East
- South America
- Brazil
- Argentina
- Rest of South America
- North America
Geography Analysis
North America held a 33.9% optical transceiver market share in 2026. JLL tracked 39 GW of active data-center capacity across North America at year-end 2025, with roughly half leased and the other half owned by hyperscalers. That infrastructure provides a substantial base of facilities requiring optical connectivity, while its ownership mix makes both tenant networks and hyperscale estates relevant to the commercial opportunity. Hyperscaler-owned capacity can support coordinated optical upgrades across an operator's estate, while leased facilities leave more room for tenant-specific network choices.
Asia-Pacific is forecast to be the fastest-growing geography, with a 14.95% CAGR from 2027 to 2032. A 2025 procurement award in Shenzhen, China, covered 80 400G CFP2-DCO optical modules in the extended C-band. Mapletree Industrial Trust reported that Asia-Pacific data-center total IT capacity grew 42.7% between 2024 and 2025. Australia, Malaysia and India contributed 63.9% of incremental 2025 capacity, particularly in committed and early-stage categories, so Asia-Pacific module demand follows when those projects become operating facilities.
In Europe, Telxius and Nokia's September 2026 collaboration to deploy 800G coherent pluggables included European terrestrial transport networks. In the Middle East, e& UAE reported in December 2025 that 400G links had been deployed across its UAE EMIX core, a wholesale transit platform. The UAE upgrade addressed carrier, internet-service-provider, and mobile-operator requirements, making wholesale transit a distinct route to optical-network investment. South America's operator channel includes Brazil, where Algar reported investing in Padtec's 400 Gb/s QSFP-DD coherent pluggables in December 2025 for planned capacity expansion across 7 capitals and Uberlandia. Telxius's multi-region upgrade, e& UAE's wholesale transit core and Algar's planned Brazilian city expansions are separate operator programs, so a module qualified for one does not by itself meet the requirements of the others.
- Coherent Corp.
- Lumentum Holdings
- Broadcom Inc.
- Accelink Technologies
- Sumitomo Electric Industries
- Furukawa FITEL Optical Components
- Source Photonics
- Huawei Technologies
- Cisco Systems (Acacia)
- Innolight Technology
- Ligent Technologies
- Eoptolink Technology
- Applied Optoelectronics
- Marvell Technology
- Credo Technology
- Ciena Corp.
- HUBER+SUHNER Cube Optics
- POET Technologies
- Molex LLC
- Lumentum Holdings Inc.
Additional Benefits:
- The market estimate (ME) sheet in Excel format
- 3 months of analyst support
TABLE OF CONTENTS
1 INTRODUCTION
- 1.1 Study Assumptions and Market Definition
- 1.2 Scope of the Study
2 RESEARCH METHODOLOGY
3 EXECUTIVE SUMMARY
4 MARKET LANDSCAPE
- 4.1 Market Overview
- 4.2 Market Drivers
- 4.2.1 Hyperscale Data-Center Expansion
- 4.2.2 5G Fronthaul and Backhaul Fiber Build-Out
- 4.2.3 Migration to 400G and 800G Ethernet
- 4.2.4 Growing Cloud AI / ML Clusters Adopting CPO
- 4.2.5 Temperature-Hardened Modules for LEO Satellites
- 4.2.6 Rise of Linear Pluggable Optics Reducing Power and Cost
- 4.3 Market Restraints
- 4.3.1 CAPEX Burden to Upgrade Legacy Fiber Plants
- 4.3.2 Laser-Diode and DSP Supply Constraints
- 4.3.3 High Power Consumption of greater than 800G Modules
- 4.3.4 IP Licensing Barriers for Second-Source Vendors
- 4.4 Industry Value Chain Analysis
- 4.5 Regulatory Landscape
- 4.6 Technological Outlook
- 4.7 Porter's Five Forces Analysis
- 4.7.1 Threat of New Entrants
- 4.7.2 Bargaining Power of Suppliers
- 4.7.3 Bargaining Power of Buyers
- 4.7.4 Threat of Substitutes
- 4.7.5 Competitive Rivalry
- 4.8 Impact of Macroeconomic Factors on the Market
- 4.9 Investment Analysis
5 MARKET SIZE AND GROWTH FORECASTS (VALUE)
- 5.1 By Protocol
- 5.1.1 Ethernet
- 5.1.2 InfiniBand
- 5.1.3 Fibre Channel
- 5.1.4 CWDM / DWDM
- 5.1.5 FTTx / PON
- 5.1.6 Other Protocols
- 5.2 By Data Rate
- 5.2.1 Less than 10 Gbps
- 5.2.2 10 - 40 Gbps
- 5.2.3 40 - 100 Gbps
- 5.2.4 100 - 400 Gbps
- 5.2.5 Greater than 400 Gbps
- 5.3 By Form Factor
- 5.3.1 SFP / SFP+
- 5.3.2 QSFP / QSFP+
- 5.3.3 QSFP28 / QSFP-DD
- 5.3.4 CFP / CFP2 / CFP4
- 5.3.5 OSFP
- 5.3.6 Other Form Factors
- 5.4 By Fiber Type
- 5.4.1 Single-Mode
- 5.4.2 Multi-Mode
- 5.5 By Reach Distance
- 5.5.1 Short-Reach (Less than 10 km)
- 5.5.2 Medium-Reach (10 - 40 km)
- 5.5.3 Long-Reach (Greater than 40 km)
- 5.6 By Application
- 5.6.1 Data Centers
- 5.6.2 Telecommunications
- 5.6.3 Enterprise / Campus
- 5.6.4 Industrial and Other Applications
- 5.7 By Geography
- 5.7.1 North America
- 5.7.1.1 United States
- 5.7.1.2 Canada
- 5.7.1.3 Mexico
- 5.7.2 Europe
- 5.7.2.1 Germany
- 5.7.2.2 United Kingdom
- 5.7.2.3 France
- 5.7.2.4 Russia
- 5.7.2.5 Rest of Europe
- 5.7.3 Asia-Pacific
- 5.7.3.1 China
- 5.7.3.2 Japan
- 5.7.3.3 India
- 5.7.3.4 South Korea
- 5.7.3.5 Australia
- 5.7.3.6 Rest of Asia-Pacific
- 5.7.4 Middle East and Africa
- 5.7.4.1 Middle East
- 5.7.4.1.1 Saudi Arabia
- 5.7.4.1.2 United Arab Emirates
- 5.7.4.1.3 Rest of Middle East
- 5.7.4.2 Africa
- 5.7.4.2.1 South Africa
- 5.7.4.2.2 Egypt
- 5.7.4.2.3 Rest of Africa
- 5.7.4.1 Middle East
- 5.7.5 South America
- 5.7.5.1 Brazil
- 5.7.5.2 Argentina
- 5.7.5.3 Rest of South America
- 5.7.1 North America
6 COMPETITIVE LANDSCAPE
- 6.1 Market Concentration
- 6.2 Strategic Moves
- 6.3 Market Share Analysis
- 6.4 Company Profiles (includes Global level Overview, Market level overview, Core Segments, Financials as available, Strategic Information, Market Rank/Share for key companies, Products and Services, and Recent Developments)
- 6.4.1 Coherent Corp.
- 6.4.2 Lumentum Holdings
- 6.4.3 Broadcom Inc.
- 6.4.4 Accelink Technologies
- 6.4.5 Sumitomo Electric Industries
- 6.4.6 Furukawa FITEL Optical Components
- 6.4.7 Source Photonics
- 6.4.8 Huawei Technologies
- 6.4.9 Cisco Systems (Acacia)
- 6.4.10 Innolight Technology
- 6.4.11 Ligent Technologies
- 6.4.12 Eoptolink Technology
- 6.4.13 Applied Optoelectronics
- 6.4.14 Marvell Technology
- 6.4.15 Credo Technology
- 6.4.16 Ciena Corp.
- 6.4.17 HUBER+SUHNER Cube Optics
- 6.4.18 POET Technologies
- 6.4.19 Molex LLC
- 6.4.20 Lumentum Holdings Inc.
7 MARKET OPPORTUNITIES AND FUTURE OUTLOOK
- 7.1 White-Space and Unmet-Need Assessment

