PUBLISHER: Mordor Intelligence | PRODUCT CODE: 2187671

PUBLISHER: Mordor Intelligence | PRODUCT CODE: 2187671
Quick-Service Restaurant (QSR) - Market Share Analysis, Industry Trends & Statistics, Growth Forecasts (2027 - 2032)
According to Mordor Intelligence, the quick-service restaurant (QSR) market size is projected to expand from USD 1.16 trillion in 2026 and USD 1.26 trillion in 2027 to USD 1.87 trillion by 2032, registering a CAGR of 8.18% between 2027 and 2032.
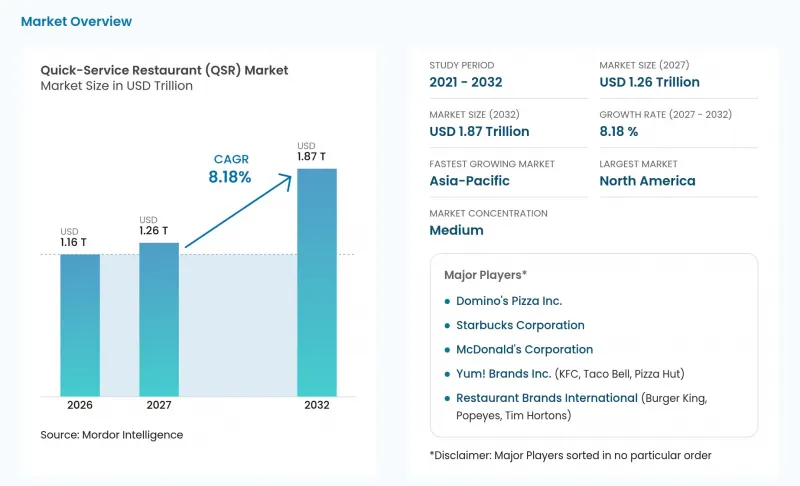
This report is segmented by Cuisine (Meat-based Cuisine, Burger/Sandwich, and more), Structure (Chained/Franchised Outlets and Independent Outlets), Service Model (Dine-In, Drive-Thru, and more), and Geography (North America, Asia-Pacific, and more). The market forecasts are provided in terms of value (USD), based on availability.
Global Quick-Service Restaurant (QSR) Market Trends and Insights
Expansion of drive-thru and off-premise channels
Off-premise expansion allows restaurant demand to extend beyond the capacity and availability of dining-room seating. Arcos Dorados reported systemwide drive-thru sales growth of 19.5% between 2021 and 2025 across its 21 Latin American and Caribbean countries and territories. That system comprises McDonald's-branded restaurants operated by Arcos Dorados or its sub-franchisees. In the broader U.S. limited-service segment, including quick-service, fast-casual, and coffee-and-snack concepts, Technomic's estimated off-premises share of customer traffic rose from 74.1% in 2019 to 89.9% in 2025. Arcos Dorados tied its drive-thru performance partly to its free-standing restaurant portfolio, indicating that site format can shape which operators benefit from off-premises demand.
Rapid urbanization and busy lifestyle accelerating quick-service restaurants
Urban concentration enlarges the potential catchment for nearby quick-service meals, while time-sensitive diners give operators a reason to simplify service. Using its Degree of Urbanization city definition, UN DESA estimated that cities housed 45% of the world's 8.2 billion people in 2025, compared with 20% in 1950. In Leger's May 2025 online panel survey of 1,626 Canadian adults for Square, 35% of QSR visitors cited fast service as the top visit driver, compared with 33% for affordability and 28% for taste. Speed therefore addresses a meal-selection need, but affordability's similar level of stated importance makes price part of the same convenience proposition. Ipsos' August 2026 study found 74% of 1,700 U.S. respondents aged 18 to 75 who visited a QSR in the prior 30 days had used a restaurant app to order ahead. Advance ordering therefore offers a way to pursue valued time savings before arrival.
Rising competition from fast-casual and food delivery services
Competition over meal delivery can constrain a restaurant brand even when customers continue ordering prepared food. Domino's FY2025 annual report said competition from delivery aggregators and other food-delivery services had substantially increased and could pressure growth and market share. The franchisor's disclosure covered competition for customers and drivers within its delivery and carryout business. This creates a commercial constraint because a restaurant must compete both to win an order and to secure the capacity needed to complete it. Domino's described pressure to grow simply to maintain market share, so expanding delivery can become a defense of existing demand before it offers pizza operators an avenue to additional profit.
Other drivers and restraints analyzed in the detailed report include:
- Digital loyalty and subscription programs boosting repeat visits
- Expansion of delivery and digital ordering
- Labor-cost inflation in high-wage markets compressing margins
For complete list of drivers and restraints, kindly check the Table Of Contents.
Segment Analysis
Meat-based cuisine accounted for a 36.95% share of the quick-service restaurant (QSR) market size in 2026. Chicken-focused Chick-fil-A recorded a USD 7.2 million average unit volume across its U.S. restaurants in 2025, according to Circana. Substantial sales at a focused restaurant concept illustrate the largest segment's commercial weight, making outlet productivity a useful lens alongside network size. Scaling a meat-focused network depends on reproducing unit productivity, since a new restaurant must establish its own meal demand to approach an existing concept's sales density.
Pizza/pasta is the fastest-growing segment, with a forecast CAGR of 10.05% between 2027 and 2032. Jubilant FoodWorks reported 88 Domino's India store additions in the quarter ended September 30, 2026, taking the network to 2,601, in a provisional update subject to limited review by its statutory auditors. For pizza operators in India, the added locations can bring ordering and fulfillment closer to customers beyond existing restaurants' reach. Mexican cuisine's U.S. limited-service purchase frequency rose 4% year over year in 2025, while units per trip fell 1% and spending per unit rose 5%, across quick-service and fast-casual formats. Among Mexican concepts within other cuisines, more frequent purchases coincided with higher spending per item and fewer items per trip.
Complete Report Scope:
- By Cuisine
- Burger/Sandwich
- Pizza/Pasta
- Meat-based Cuisine
- Seafood
- Ice-Cream/Dessert
- Bakery Products
- Other Cuisines (Mexican, Asian, etc.)
- By Structure
- Independent Outlets
- Chained/Franchised Outlets
- By Service Model
- Dine-In
- Drive-Thru
- Take-Away/Walk-Up Counter
- Home Delivery (First- and Third-Party)
- Curbside Pickup
- By Geography
- North America
- United States
- Canada
- Mexico
- Rest of North America
- Europe
- Germany
- United Kingdom
- Italy
- France
- Spain
- Netherlands
- Poland
- Belgium
- Sweden
- Rest of Europe
- Asia-Pacific
- China
- India
- Japan
- Australia
- Indonesia
- South Korea
- Thailand
- Singapore
- Rest of Asia-Pacific
- South America
- Brazil
- Argentina
- Colombia
- Chile
- Peru
- Rest of South America
- Middle East and Africa
- South Africa
- Saudi Arabia
- United Arab Emirates
- Nigeria
- Egypt
- Morocco
- Turkey
- Rest of Middle East and Africa
- North America
Geography Analysis
North America held a 32.24% quick-service restaurant (QSR) market share in 2026, making it the largest geography. U.S. limited-service establishments recorded inflation-adjusted food sales of USD 516.1 billion in 2025, compared with USD 273.8 billion in 1997, an 88.5% increase across that period. USDA defines limited-service outlets as establishments where customers generally order and pay before eating, with meals consumed on premises, taken out, or delivered. This established spending base gives restaurant operators substantial meal demand to address, while the ordering model makes convenient access part of their ability to convert that demand into sales.
Asia-Pacific is the fastest-growing geography, with a forecast CAGR of 10.2% between 2027 and 2032. Yum China Holdings' same-store transactions in China grew 5% year over year in Q2 2026, its 14th consecutive quarter of growth. It opened 560 net new stores in China that quarter, 67% more than in Q2 2025, with 41% of net new stores opened by franchisees. Franchisees operated 18% of its 19,297-store network at June 30, 2026. Franchisees' larger contribution to new openings than to the installed estate gives their development capability a disproportionate role in that quarter's expansion.
In Europe, KFC opened a digital-first flagship near Rome's Trevi Fountain in October 2025. The Rome flagship's restaurant environment and specialty drinks illustrate a format-led approach to serving that European urban location. In South America, Pluxee and Abrasel reported Wednesday's 21.54% share of measured food-away-from-home consumption volume in Brazil in 2025. In the Middle East and Africa, Americana Restaurants opened 4 Pizza Hut restaurants across Dubai, Sharjah, Ajman, and Fujairah in the United Arab Emirates in 2025. For restaurants serving these Brazilian meal occasions, allocating the same staffing and replenishment capacity to every weekday would overlook the measured concentration of demand on Wednesday.
- McDonald's Corporation
- Yum! Brands Inc. (KFC, Taco Bell, Pizza Hut)
- Restaurant Brands International (Burger King, Popeyes, Tim Hortons)
- Domino's Pizza Inc.
- Starbucks Corporation
- The Wendy's Company
- Doctor's Associates LLC (Subway)
- Chick-fil-A Inc.
- Chipotle Mexican Grill Inc.
- Deep Blue Restaurants
- Panera Bread Company
- Papa John's International Inc.
- Shake Shack Inc.
- Jack in the Box Inc.
- Inspire Brands, Inc.
- Jollibee Foods Corporation
- Jubilant FoodWorks Ltd (Domino's India)
- Yoshinoya Holdings Co. Ltd.
- Little Caesar Enterprises Inc.
- Five Guys Enterprises, LLC
Additional Benefits:
- The market estimate (ME) sheet in Excel format
- 3 months of analyst support
TABLE OF CONTENTS
1 INTRODUCTION
- 1.1 Study Assumptions and Market Definition
- 1.2 Scope of the Study
2 RESEARCH METHODOLOGY
3 EXECUTIVE SUMMARY
4 MARKET LANDSCAPE
- 4.1 Market Overview
- 4.2 Market Drivers
- 4.2.1 Expansion of drive-thru and off-premise channels
- 4.2.2 Rapid urbanization and busy lifestyle accelerating quick-service restaurants
- 4.2.3 Digital loyalty and subscription programs boosting repeat visits
- 4.2.4 Expansion of delivery and digital ordering
- 4.2.5 Tech integration and automation
- 4.2.6 Rising tourism and out-of-home dining
- 4.3 Market Restraints
- 4.3.1 Rising competition from fast-casual and food delivery services
- 4.3.2 Labor-cost inflation in high-wage markets compressing margins
- 4.3.3 Rising obesity and chronic diseases
- 4.3.4 Intense market competition
- 4.4 Industry Value Chain Analysis
- 4.5 Regulatory Landscape
- 4.6 Technological Outlook
- 4.7 Porter's Five Forces Analysis
- 4.7.1 Threat of New Entrants
- 4.7.2 Bargaining Power of Suppliers
- 4.7.3 Bargaining Power of Buyers
- 4.7.4 Threat of Substitutes
- 4.7.5 Competitive Rivalry
- 4.8 Menu Analysis
5 MARKET SIZE AND GROWTH FORECASTS (VALUE)
- 5.1 By Cuisine
- 5.1.1 Burger/Sandwich
- 5.1.2 Pizza/Pasta
- 5.1.3 Meat-based Cuisine
- 5.1.4 Seafood
- 5.1.5 Ice-Cream/Dessert
- 5.1.6 Bakery Products
- 5.1.7 Other Cuisines (Mexican, Asian, etc.)
- 5.2 By Structure
- 5.2.1 Independent Outlets
- 5.2.2 Chained/Franchised Outlets
- 5.3 By Service Model
- 5.3.1 Dine-In
- 5.3.2 Drive-Thru
- 5.3.3 Take-Away/Walk-Up Counter
- 5.3.4 Home Delivery (First- and Third-Party)
- 5.3.5 Curbside Pickup
- 5.4 By Geography
- 5.4.1 North America
- 5.4.1.1 United States
- 5.4.1.2 Canada
- 5.4.1.3 Mexico
- 5.4.1.4 Rest of North America
- 5.4.2 Europe
- 5.4.2.1 Germany
- 5.4.2.2 United Kingdom
- 5.4.2.3 Italy
- 5.4.2.4 France
- 5.4.2.5 Spain
- 5.4.2.6 Netherlands
- 5.4.2.7 Poland
- 5.4.2.8 Belgium
- 5.4.2.9 Sweden
- 5.4.2.10 Rest of Europe
- 5.4.3 Asia-Pacific
- 5.4.3.1 China
- 5.4.3.2 India
- 5.4.3.3 Japan
- 5.4.3.4 Australia
- 5.4.3.5 Indonesia
- 5.4.3.6 South Korea
- 5.4.3.7 Thailand
- 5.4.3.8 Singapore
- 5.4.3.9 Rest of Asia-Pacific
- 5.4.4 South America
- 5.4.4.1 Brazil
- 5.4.4.2 Argentina
- 5.4.4.3 Colombia
- 5.4.4.4 Chile
- 5.4.4.5 Peru
- 5.4.4.6 Rest of South America
- 5.4.5 Middle East and Africa
- 5.4.5.1 South Africa
- 5.4.5.2 Saudi Arabia
- 5.4.5.3 United Arab Emirates
- 5.4.5.4 Nigeria
- 5.4.5.5 Egypt
- 5.4.5.6 Morocco
- 5.4.5.7 Turkey
- 5.4.5.8 Rest of Middle East and Africa
- 5.4.1 North America
6 COMPETITIVE LANDSCAPE
- 6.1 Market Concentration
- 6.2 Strategic Moves
- 6.3 Market Share Analysis
- 6.4 Company Profiles (includes Global level Overview, Market level overview, Core Segments, Financials as available, Strategic Information, Market Rank/Share for key companies, Products and Services, and Recent Developments)
- 6.4.1 McDonald's Corporation
- 6.4.2 Yum! Brands Inc. (KFC, Taco Bell, Pizza Hut)
- 6.4.3 Restaurant Brands International (Burger King, Popeyes, Tim Hortons)
- 6.4.4 Domino's Pizza Inc.
- 6.4.5 Starbucks Corporation
- 6.4.6 The Wendy's Company
- 6.4.7 Doctor's Associates LLC (Subway)
- 6.4.8 Chick-fil-A Inc.
- 6.4.9 Chipotle Mexican Grill Inc.
- 6.4.10 Deep Blue Restaurants
- 6.4.11 Panera Bread Company
- 6.4.12 Papa John's International Inc.
- 6.4.13 Shake Shack Inc.
- 6.4.14 Jack in the Box Inc.
- 6.4.15 Inspire Brands, Inc.
- 6.4.16 Jollibee Foods Corporation
- 6.4.17 Jubilant FoodWorks Ltd (Domino's India)
- 6.4.18 Yoshinoya Holdings Co. Ltd.
- 6.4.19 Little Caesar Enterprises Inc.
- 6.4.20 Five Guys Enterprises, LLC
7 MARKET OPPORTUNITIES AND FUTURE OUTLOOK
- 7.1 White-Space and Unmet-Need Assessment

