PUBLISHER: Mordor Intelligence | PRODUCT CODE: 2187682

PUBLISHER: Mordor Intelligence | PRODUCT CODE: 2187682
Fertilizers - Market Share Analysis, Industry Trends & Statistics, Growth Forecasts (2027 - 2032)
According to Mordor Intelligence, the fertilizers market size is expected to increase from USD 229.6 billion in 2026 to USD 239.6 billion in 2027 and reach USD 294 billion by 2032, growing at a CAGR of 4.18% over 2027-2032.
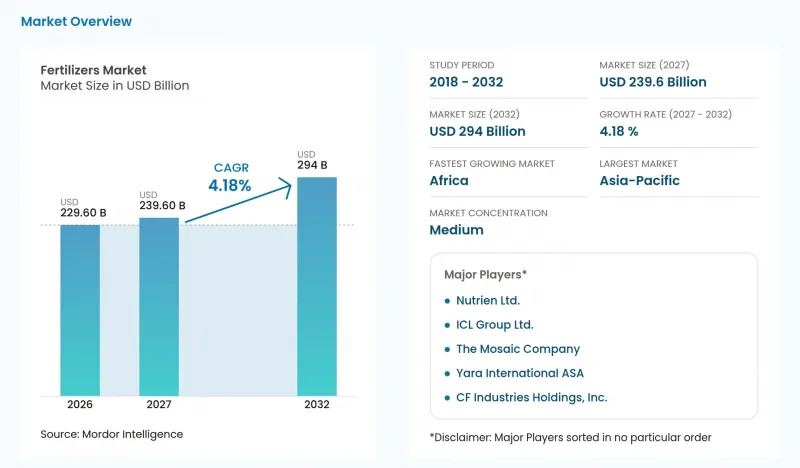
The fertilizers market volume is expected to increase from 537.1 million Metric Tons in 2026 to 548.4 million Metric Tons in 2027 and reach 608.5 million Metric Tons by 2032, growing at a CAGR of 2.1% over 2027-2032. This report is segmented by Type (Straight and Complex), Form (Conventional and Specialty), Application Mode (Soil, Fertigation, and Foliar), Crop Type (Field Crops, Horticultural Crops, and Turf and Ornamental), and Geography (Asia-Pacific, South America, North America, Europe, Africa, and Middle East). The market forecasts are provided in terms of value (USD) and volume (Metric Tons), based on availability.
Global Fertilizers Market Trends and Insights
Surge in fertilizer demand from precision-agriculture projects
Precision projects can broaden the commercial role of fertilizer by making its use part of a digital farm-management program. In May 2025, Syngenta and Al Dahra announced a partnership to implement digital solutions across more than 220,000 acres of Al Dahra farms in Romania, Serbia, Egypt and Morocco. Syngenta would provide fertilizer-targeting tools, while Al Dahra operates the farms. Al Dahra identifies fertilizers as direct-buy agricultural inputs in its procurement strategy. The program connects fertilizer targeting on the announced farm footprint with an operator that buys fertilizer directly, giving the initiative a commercial link to input sales.
Transition to climate-smart nutrient-management policies
Climate-smart nutrient policy can connect fertilizer demand with both farm-management support and the production pathway of the nutrient product. The European Commission adopted its Fertiliser Action Plan on May 19, 2026, encouraging European Union farmers to use eco-schemes and advisory services to improve nutrient-management efficiency. The plan also supports decarbonized, low-fossil and circular fertilizers. Advisory support and eco-schemes create a setting in which a circular or lower-fossil fertilizer offer can be considered alongside an explicit nutrient-efficiency objective. Suppliers of circular and lower-fossil fertilizers can link their offer to both nutrient-efficiency advice and production pathways, giving farmers a policy-supported reason to consider these products.
Volatile feedstock prices
Feedstock volatility can constrain affordable fertilizer demand by increasing the cost of producing finished nutrients. The Middle East conflict-related commodity supply disruption began in February 2026. The World Bank reported that global fertilizer prices rose in the first quarter of 2026 amid supply disruptions, higher input costs and trade restrictions. Affordability deteriorated markedly for urea, measured as fertilizer prices relative to the food price index. Separately, Nutrien reported higher cost of goods sold per metric ton in 2025 than in 2024, mainly from natural-gas costs linked to Henry Hub. Absorbing those increases can compress producer margins, while passing them through raises the affordability barrier that limits the commercial reach of nitrogen fertilizer.
Other drivers and restraints analyzed in the detailed report include:
- Rapid adoption of specialty and slow-release formulations
- Capacity expansions in low-cost natural-gas regions
- Regulatory caps on nitrogen usage in Europe
For complete list of drivers and restraints, kindly check the Table Of Contents.
Segment Analysis
Straight fertilizers accounted for a 62.5% share of the fertilizers market size in 2026, making them the largest segment. India recorded 35.26 million metric tons of urea sales from April 2025 through January 2026, compared with 34.59 million in the same months a year earlier. India's Urea Subsidy Scheme fixes a maximum retail price for farmers, while manufacturers and importers receive reimbursement for the difference between delivered cost and market realization. Reimbursement-backed pricing can anchor a large farmer outlet for urea suppliers, making the subsidy mechanism commercially significant alongside physical product availability.
Complex fertilizers are forecast to be the fastest-growing segment, with a 5.6% CAGR over 2027-2032. CRISIL Ratings reported that India's complex-fertilizer capacity utilization reached about 95% in fiscal 2026 amid healthy demand and limited capacity growth. In February 2026, CRISIL projected about 4 million metric tons per year of capacity additions through fiscal 2029 over an approximately 16 million base for Indian DAP and NPK grades. These planned additions offer producers a route to serve rising demand beyond the throughput of highly utilized plants.
Conventional fertilizers represented an 88.29% fertilizers market share in 2026, making them the largest segment. CF Industries' granular urea segment sold 4.11 million short tons in 2025, down 9% from 2024. Management favored urea ammonium nitrate production over granular urea, while lower beginning inventory also reduced supply availability. The granular urea business retained substantial scale while its output allocation and inventory constrained the volume available for sale. Choice between nitrogen products can become a source of supply exposure for granular urea buyers, even within an established conventional fertilizer business.
Specialty fertilizers are forecast to be the fastest-growing segment, at a 6.1% CAGR over 2027-2032. SQM reported Specialty Plant Nutrition business sales of 1.01 million metric tons in 2025, compared with 982.9 thousand metric tons in 2024. Those business-line sales include SQM-produced products and third-party products sold under a commercial agreement, connecting the offer with both internal manufacturing and external supply. This structure provides a route to broaden a specialty offering without making every additional sale depend on the company's own production, so access to complementary products can contribute alongside manufacturing scale.
Complete Report Scope:
- By Type
- Complex
- Straight
- Micronutrients
- Boron
- Copper
- Iron
- Manganese
- Molybdenum
- Zinc
- Others
- Nitrogenous
- Ammonium Nitrate
- Anhydrous Ammonia
- Urea
- Others
- Phosphatic
- Di-ammonium Phosphate (DAP)
- Mono Ammonium Phosphate (MAP)
- Single Super Phosphate (SSP)
- Triple Superphosphate (TSP)
- Others
- Potassic
- Muriate of Potash (MoP)
- Sulphate of Potash (SoP)
- Others
- Secondary Macronutrients
- Calcium
- Magnesium
- Sulfur
- Micronutrients
- By Form
- Conventional
- Specialty
- Controlled-Release Fertilizer (CRF)
- Liquid Fertilizer
- Slow-Release Fertilizer (SRF)
- Water Soluble
- By Application Mode
- Fertigation
- Foliar
- Soil
- By Crop Type
- Field Crops
- Horticultural Crops
- Turf and Ornamental
- By Geography
- North America
- Canada
- Mexico
- United States
- Rest of North America
- Europe
- France
- Germany
- Italy
- Netherlands
- Russia
- Spain
- Ukraine
- United Kingdom
- Rest of Europe
- Asia-Pacific
- Australia
- Bangladesh
- China
- India
- Indonesia
- Japan
- Pakistan
- Philippines
- Thailand
- Vietnam
- Rest of Asia-Pacific
- South America
- Argentina
- Brazil
- Rest of South America
- Middle East
- Turkey
- Saudi Arabia
- Rest of Middle East
- Africa
- Nigeria
- South Africa
- Rest of Africa
- North America
Geography Analysis
Asia-Pacific accounted for a 52.2% fertilizers market share in 2026, making it the largest geography. China's industrial enterprises above designated size produced 64.81 million metric tons of chemical fertilizer on a 100% equivalent basis in 2025, up 7.1% from 2024. The International Fertilizer Association's (IFA) May 2026 outlook linked global nitrogen-use growth through its forecast for the 2025/26 fertilizer year to East and South Asia, highlighting China and India as dominant consumers and China's export restrictions to protect domestic affordability. Chinese production growth alone does not assure additional export supply, because China has periodically restricted urea and phosphate exports to keep fertilizer prices affordable for Chinese farmers.
Africa is forecast to be the fastest-growing geography, with a 6% CAGR over 2027-2032. IFA's May 2026 outlook projected increasing phosphate fertilizer use through the 2025/26 fertilizer year, driven by North Africa with growth also present in Sub-Saharan Africa. Separately, Ghana's Ministry of Food and Agriculture handed 40,000 bags of inorganic fertilizer to the Peasant Farmers Association of Ghana in June 2026 for onward distribution under the Feed Ghana Programme. This channel targeted member farmers, particularly those who might not benefit from district-level allocations. The mechanism is state-supported access, with the handover routing product through a farmer organization, so volume reaching member farmers in this channel depends on distribution reach as well as fertilizer availability.
A 2025 report by the Food and Agriculture Organization of the United Nations identified North America among the regions where decades of extensive fertilizer use and misuse had created severe nitrogen pollution. Within Europe, the European Commission described EU farmers' limited ability to pass higher fertilizer costs through to crop prices, linking higher input prices with reduced nutrient use and lower yields. In South America, Fertilizar preliminarily estimated Argentina's fertilizer application at 5.1 million metric tons in 2025, up 3% from 2024. The Middle East's producer base included Qatar Fertiliser Company's integrated complex in Mesaieed, which reported record urea production in 2025. Argentina's application gains offer suppliers a volume opportunity, whereas EU farmers' limited ability to recover input costs makes higher fertilizer prices a threat to nutrient sales.
- Nutrien Ltd.
- Uralkali PJSC (Uralchem Group)
- The Mosaic Company
- K+S Aktiengesellschaft
- ICL Group Ltd.
- EuroChem Group AG
- CF Industries Holdings, Inc.
- OCP S.A.
- PhosAgro PJSC
- Coromandel International Limited
- Indian Farmers Fertiliser Cooperative Limited (IFFCO)
- Haifa Chemicals Ltd.
- Yara International ASA
- Koch Fertilizer, LLC
- Grupa Azoty S.A. (Compo Expert)
- BHP Group Limited
- Qinghai Salt Lake Industry Co., Ltd.
Additional Benefits:
- The market estimate (ME) sheet in Excel format
- 3 months of analyst support
TABLE OF CONTENTS
1 INTRODUCTION
- 1.1 Study Assumptions and Market Definition
- 1.2 Scope of the Study
2 RESEARCH METHODOLOGY
3 EXECUTIVE SUMMARY
4 MARKET LANDSCAPE
- 4.1 Market Overview
- 4.2 Market Drivers
- 4.2.1 Surge in fertilizer demand from precision-agriculture projects
- 4.2.2 Transition to climate-smart nutrient-management policies
- 4.2.3 Rapid adoption of specialty and slow-release formulations
- 4.2.4 Capacity expansions in low-cost natural-gas regions
- 4.2.5 Carbon-credit incentives for green ammonia production
- 4.2.6 Artificial intelligence enabled variable-rate application platforms
- 4.3 Market Restraints
- 4.3.1 Volatile feedstock prices
- 4.3.2 Regulatory caps on nitrogen usage in Europe
- 4.3.3 Growing organic farming acreage
- 4.3.4 Scarcity of water for fertigation in arid regions
- 4.4 Industry Value Chain Analysis
- 4.5 Regulatory Landscape
- 4.6 Technological Outlook
- 4.7 Porter's Five Forces Analysis
- 4.7.1 Threat of New Entrants
- 4.7.2 Bargaining Power of Suppliers
- 4.7.3 Bargaining Power of Buyers
- 4.7.4 Threat of Substitutes
- 4.7.5 Competitive Rivalry
- 4.8 REPORT OFFERS
- 4.9 EXECUTIVE SUMMARY AND KEY FINDINGS
- 4.10 Acreage of Major Crop Types
- 4.10.1 Field Crops
- 4.10.2 Horticultural Crops
- 4.11 Average Nutrient Application Rates
- 4.11.1 Micronutrients
- 4.11.1.1 Field Crops
- 4.11.1.2 Horticultural Crops
- 4.11.2 Primary Nutrients
- 4.11.2.1 Field Crops
- 4.11.2.2 Horticultural Crops
- 4.11.3 Secondary Macronutrients
- 4.11.3.1 Field Crops
- 4.11.3.2 Horticultural Crops
- 4.11.1 Micronutrients
- 4.12 Agricultural Land Equipped for Irrigation
- 4.13 KEY STRATEGIC QUESTIONS FOR FERTILIZER CEOS
5 MARKET SIZE AND GROWTH FORECASTS (VALUE AND VOLUME)
- 5.1 By Type
- 5.1.1 Complex
- 5.1.2 Straight
- 5.1.2.1 Micronutrients
- 5.1.2.1.1 Boron
- 5.1.2.1.2 Copper
- 5.1.2.1.3 Iron
- 5.1.2.1.4 Manganese
- 5.1.2.1.5 Molybdenum
- 5.1.2.1.6 Zinc
- 5.1.2.1.7 Others
- 5.1.2.2 Nitrogenous
- 5.1.2.2.1 Ammonium Nitrate
- 5.1.2.2.2 Anhydrous Ammonia
- 5.1.2.2.3 Urea
- 5.1.2.2.4 Others
- 5.1.2.3 Phosphatic
- 5.1.2.3.1 Di-ammonium Phosphate (DAP)
- 5.1.2.3.2 Mono Ammonium Phosphate (MAP)
- 5.1.2.3.3 Single Super Phosphate (SSP)
- 5.1.2.3.4 Triple Superphosphate (TSP)
- 5.1.2.3.5 Others
- 5.1.2.4 Potassic
- 5.1.2.4.1 Muriate of Potash (MoP)
- 5.1.2.4.2 Sulphate of Potash (SoP)
- 5.1.2.4.3 Others
- 5.1.2.5 Secondary Macronutrients
- 5.1.2.5.1 Calcium
- 5.1.2.5.2 Magnesium
- 5.1.2.5.3 Sulfur
- 5.1.2.1 Micronutrients
- 5.2 By Form
- 5.2.1 Conventional
- 5.2.2 Specialty
- 5.2.2.1 Controlled-Release Fertilizer (CRF)
- 5.2.2.2 Liquid Fertilizer
- 5.2.2.3 Slow-Release Fertilizer (SRF)
- 5.2.2.4 Water Soluble
- 5.3 By Application Mode
- 5.3.1 Fertigation
- 5.3.2 Foliar
- 5.3.3 Soil
- 5.4 By Crop Type
- 5.4.1 Field Crops
- 5.4.2 Horticultural Crops
- 5.4.3 Turf and Ornamental
- 5.5 By Geography
- 5.5.1 North America
- 5.5.1.1 Canada
- 5.5.1.2 Mexico
- 5.5.1.3 United States
- 5.5.1.4 Rest of North America
- 5.5.2 Europe
- 5.5.2.1 France
- 5.5.2.2 Germany
- 5.5.2.3 Italy
- 5.5.2.4 Netherlands
- 5.5.2.5 Russia
- 5.5.2.6 Spain
- 5.5.2.7 Ukraine
- 5.5.2.8 United Kingdom
- 5.5.2.9 Rest of Europe
- 5.5.3 Asia-Pacific
- 5.5.3.1 Australia
- 5.5.3.2 Bangladesh
- 5.5.3.3 China
- 5.5.3.4 India
- 5.5.3.5 Indonesia
- 5.5.3.6 Japan
- 5.5.3.7 Pakistan
- 5.5.3.8 Philippines
- 5.5.3.9 Thailand
- 5.5.3.10 Vietnam
- 5.5.3.11 Rest of Asia-Pacific
- 5.5.4 South America
- 5.5.4.1 Argentina
- 5.5.4.2 Brazil
- 5.5.4.3 Rest of South America
- 5.5.5 Middle East
- 5.5.5.1 Turkey
- 5.5.5.2 Saudi Arabia
- 5.5.5.3 Rest of Middle East
- 5.5.6 Africa
- 5.5.6.1 Nigeria
- 5.5.6.2 South Africa
- 5.5.6.3 Rest of Africa
- 5.5.1 North America
6 COMPETITIVE LANDSCAPE
- 6.1 Market Concentration
- 6.2 Strategic Moves
- 6.3 Market Share Analysis
- 6.4 Company Profiles (includes Global level Overview, Market level overview, Core Segments, Financials as available, Strategic Information, Market Rank/Share for key companies, Products and Services, and Recent Developments)
- 6.4.1 Nutrien Ltd.
- 6.4.2 Uralkali PJSC (Uralchem Group)
- 6.4.3 The Mosaic Company
- 6.4.4 K+S Aktiengesellschaft
- 6.4.5 ICL Group Ltd.
- 6.4.6 EuroChem Group AG
- 6.4.7 CF Industries Holdings, Inc.
- 6.4.8 OCP S.A.
- 6.4.9 PhosAgro PJSC
- 6.4.10 Coromandel International Limited
- 6.4.11 Indian Farmers Fertiliser Cooperative Limited (IFFCO)
- 6.4.12 Haifa Chemicals Ltd.
- 6.4.13 Yara International ASA
- 6.4.14 Koch Fertilizer, LLC
- 6.4.15 Grupa Azoty S.A. (Compo Expert)
- 6.4.16 BHP Group Limited
- 6.4.17 Qinghai Salt Lake Industry Co., Ltd.
7 MARKET OPPORTUNITIES AND FUTURE OUTLOOK
- 7.1 White-Space and Unmet-Need Assessment

