PUBLISHER: Mordor Intelligence | PRODUCT CODE: 2187685

PUBLISHER: Mordor Intelligence | PRODUCT CODE: 2187685
India Fertilizers - Market Share Analysis, Industry Trends & Statistics, Growth Forecasts (2027 - 2032)
According to Mordor Intelligence, the India fertilizers market size is expected to increase from USD 25.06 billion in 2026 to USD 26.39 billion in 2027 and reach USD 34.16 billion by 2032, growing at a CAGR of 5.3% over 2027-2032.
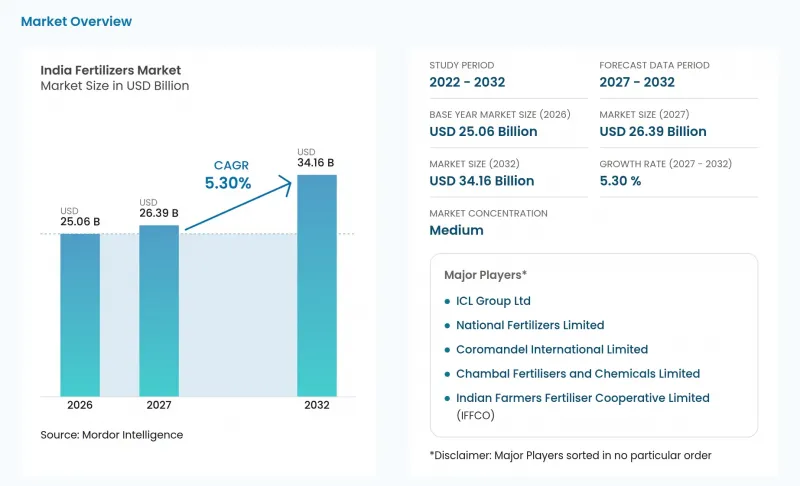
This report is segmented by Type (Straight and Complex), Form (Conventional and Specialty), Application Mode (Soil, Fertigation, and more), and Crop Type (Field Crops, Horticultural Crops, and more). The market forecasts are provided in terms of value (USD), based on availability.
India Fertilizers Market Trends and Insights
Subsidy Rationalization Toward Nutrient-Based Pricing
Subsidy design makes the nutrient composition of phosphatic and potassic grades commercially consequential. India's Nutrient-Based Subsidy scheme links fixed support to each grade's nutrient composition and revises rates annually or biannually. The Union Cabinet approved phosphatic and potassic fertilizer rates for Kharif 2026, applicable from April 1 through September 30, 2026. This mechanism can support demand by sharing the cost of supplying eligible nutrients, although the commercial benefit depends on the grade's applicable support. Periodic rate-setting also makes the season relevant when suppliers compare formulation economics. A grade's nutrient mix consequently affects both the agronomic offer and the public support underpinning its supply.
Rising Adoption of Drip Irrigation and Fertigation Systems
Micro-irrigation expansion creates a potential customer base for fertilizer suppliers offering nutrient delivery alongside controlled watering. India's Per Drop More Crop scheme had brought over 11.5 million hectares under micro-irrigation as of July 2026. The scheme also benefited 1.23 million farmers in fiscal 2025-26, giving the adoption effort a substantial recent reach. For fertilizer producers, this scale makes irrigation-linked nutrition commercially relevant even when additional fertilizer use depends on farmers adopting fertigation. Repeated nutrient applications through installed systems generate fertilizer sales after the initial irrigation investment.
Delayed Subsidy Reimbursements Straining Working Capital
Subsidy-dependent producers can face a funding gap when public payment arrives after the commercial activity it supports. In its FY2024-25 risk discussion, Mangalore Chemicals & Fertilizers Limited warned that budget under-provisioning and subsidy-payment delays could increase working-capital requirements, affect production and raise finance costs. Payment timing can therefore change the financing required to sustain fertilizer output, even when the underlying subsidy entitlement is unchanged. If budget under-provisioning delays reimbursement, the producer must carry the associated working capital until public funds arrive. The commercial constraint is financing the reimbursement interval, with production flexibility dependent on when public support becomes cash.
Other drivers and restraints analyzed in the detailed report include:
- Government Push for Balanced Nutrient Management
- Growing Availability of Nano-Urea and Nano-DAP
- Volatility in Imported Ammonia and Phosphoric Acid Prices
For complete list of drivers and restraints, kindly check the Table Of Contents.
Segment Analysis
Straight fertilizers held 80.9% of market value in 2026, making them the largest segment. Indian Farmers Fertiliser Cooperative Limited (IFFCO) produced 4.83 million metric tons of neem-coated urea in FY2025-26. In July 2026, the Urea Subsidy Scheme maintained a statutory maximum retail price for a 45-kilogram bag of urea, excluding neem-coating charges and applicable taxes. Supplier compensation was tied to the difference between delivered cost and market realization, with reimbursement directed to manufacturers and importers. For a urea supplier, statutory retail pricing makes reimbursement the route for recovering the delivered-cost gap across large production volumes.
Complex fertilizers are forecast to grow at a CAGR of 6.9% during 2027-2032, making them the fastest-growing segment. In FY2024-25, Gujarat State Fertilizers & Chemicals Limited took commercial production of 3,000 metric tons of 9:24:24 grade NPK complex fertilizer at its Sikka Unit. A defined grade gives the product a specific nutrient identity, connecting manufacturing activity to the composition a buyer would choose. Complex-fertilizer growth therefore rests on suppliers matching defined N:P:K grades such as 9:24:24 to crop programs.
Conventional fertilizers accounted for a 96.9% share of the India fertilizers market size in 2026, making them the largest segment. The Department of Fertilizers recorded 39.66 million metric tons of urea DBT sales in India during FY2025-26. That urea volume shows the scale at which one conventional product moves through the sales channel. For conventional suppliers serving this channel, replenishing urea at high volume is a distinct task from developing demand for a narrowly positioned formulation.
Specialty fertilizers are forecast to grow at a CAGR of 6.5% during 2027-2032, making them the fastest-growing segment. Deepak Fertilisers and Petrochemicals Corporation Limited reported that specialty and Croptek products together contributed 43% of its Crop Nutrition revenue in the quarter ended June 30, 2026. The company also said specialty-fertilizer volumes were affected by elevated sulfur prices, lower Bensulf utilization and regulatory restrictions in that quarter. The combined revenue contribution gives differentiated products a commercial role, while the operating pressures make dependable supply part of that proposition. Specialty expansion involves securing the operating and regulatory conditions behind saleable volumes as well as developing differentiated formulations.
Complete Report Scope:
- By Type
- Complex
- Straight
- Micronutrients
- Boron
- Copper
- Iron
- Manganese
- Molybdenum
- Zinc
- Others
- Nitrogenous
- Urea
- Others
- Phosphatic
- DAP
- MAP
- SSP
- Others
- Potassic
- MoP
- Secondary Macronutrients
- Calcium
- Magnesium
- Sulfur
- Micronutrients
- By Form
- Conventional
- Specialty
- CRF
- Liquid Fertilizer
- SRF
- Water Soluble
- By Application Mode
- Fertigation
- Foliar
- Soil
- By Crop Type
- Field Crops
- Horticultural Crops
- Turf and Ornamental
List of Companies Covered in this Report:
- Chambal Fertilisers and Chemicals Limited
- Coromandel International Limited
- Gujarat Narmada Valley Fertilizers & Chemicals Limited (Govt. of Gujarat)
- Haifa Negev Technologies Ltd.
- ICL Group Ltd
- Indian Farmers Fertiliser Cooperative Limited (IFFCO)
- National Fertilizers Limited
- Rashtriya Chemicals and Fertilizers Limited
- Sociedad Quimica y Minera de Chile SA
- Yara International ASA
- Paradeep Phosphates Limited (Zuari-Maroc Phosphates Pvt. Ltd. & OCP)
- Nagarjuna Fertilizers and Chemicals Limited (Nagarjuna Group)
- The Fertilisers and Chemicals Travancore Limited (FACT)
- Deepak Fertilisers and Petrochemicals Corporation Limited
- Krishak Bharati Cooperative Limited (KRIBHCO)
Additional Benefits:
- The market estimate (ME) sheet in Excel format
- 3 months of analyst support
TABLE OF CONTENTS
1 INTRODUCTION
- 1.1 Study Assumptions and Market Definition
- 1.2 Scope of the Study
2 RESEARCH METHODOLOGY
3 EXECUTIVE SUMMARY
4 MARKET LANDSCAPE
- 4.1 Market Overview
- 4.2 Market Drivers
- 4.2.1 Subsidy Rationalization Toward Nutrient-Based Pricing
- 4.2.2 Rising Adoption of Drip Irrigation and Fertigation Systems
- 4.2.3 Government Push for Balanced Nutrient Management
- 4.2.4 Growing Availability of Nano-Urea and Nano-DAP
- 4.2.5 Digitized Soil Health Card Analytics Enabling Micro-Dosing
- 4.2.6 Corporate Sugarcane Sustainability Programs
- 4.3 Market Restraints
- 4.3.1 Delayed Subsidy Reimbursements Straining Working Capital
- 4.3.2 Volatility in Imported Ammonia and Phosphoric Acid Prices
- 4.3.3 Environmental Compliance Costs Under Central Pollution Control Board (CPCB) Norms
- 4.3.4 Smallholder Mistrust of Specialty Fertilizers Beyond Urea
- 4.4 Industry Value Chain Analysis
- 4.5 Regulatory Landscape
- 4.6 Technological Outlook
- 4.7 Porter's Five Forces Analysis
- 4.7.1 Threat of New Entrants
- 4.7.2 Bargaining Power of Suppliers
- 4.7.3 Bargaining Power of Buyers
- 4.7.4 Threat of Substitutes
- 4.7.5 Competitive Rivalry
- 4.8 EXECUTIVE SUMMARY AND KEY FINDINGS
- 4.9 REPORT OFFERS
- 4.10 Acreage of Major Crop Types
- 4.10.1 Field Crops
- 4.10.2 Horticultural Crops
- 4.11 Average Nutrient Application Rates
- 4.11.1 Micronutrients
- 4.11.1.1 Field Crops
- 4.11.1.2 Horticultural Crops
- 4.11.2 Primary Nutrients
- 4.11.2.1 Field Crops
- 4.11.2.2 Horticultural Crops
- 4.11.3 Secondary Macronutrients
- 4.11.3.1 Field Crops
- 4.11.3.2 Horticultural Crops
- 4.11.1 Micronutrients
- 4.12 Agricultural Land Equipped For Irrigation
- 4.13 KEY STRATEGIC QUESTIONS FOR FERTILIZER CEOS
5 MARKET SIZE AND GROWTH FORECASTS (VALUE)
- 5.1 By Type
- 5.1.1 Complex
- 5.1.2 Straight
- 5.1.2.1 Micronutrients
- 5.1.2.1.1 Boron
- 5.1.2.1.2 Copper
- 5.1.2.1.3 Iron
- 5.1.2.1.4 Manganese
- 5.1.2.1.5 Molybdenum
- 5.1.2.1.6 Zinc
- 5.1.2.1.7 Others
- 5.1.2.2 Nitrogenous
- 5.1.2.2.1 Urea
- 5.1.2.2.2 Others
- 5.1.2.3 Phosphatic
- 5.1.2.3.1 DAP
- 5.1.2.3.2 MAP
- 5.1.2.3.3 SSP
- 5.1.2.3.4 Others
- 5.1.2.4 Potassic
- 5.1.2.4.1 MoP
- 5.1.2.5 Secondary Macronutrients
- 5.1.2.5.1 Calcium
- 5.1.2.5.2 Magnesium
- 5.1.2.5.3 Sulfur
- 5.1.2.1 Micronutrients
- 5.2 By Form
- 5.2.1 Conventional
- 5.2.2 Specialty
- 5.2.2.1 CRF
- 5.2.2.2 Liquid Fertilizer
- 5.2.2.3 SRF
- 5.2.2.4 Water Soluble
- 5.3 By Application Mode
- 5.3.1 Fertigation
- 5.3.2 Foliar
- 5.3.3 Soil
- 5.4 By Crop Type
- 5.4.1 Field Crops
- 5.4.2 Horticultural Crops
- 5.4.3 Turf and Ornamental
6 COMPETITIVE LANDSCAPE
- 6.1 Market Concentration
- 6.2 Strategic Moves
- 6.3 Market Share Analysis
- 6.4 Company Profiles (includes Global level Overview, Market level overview, Core Segments, Financials as available, Strategic Information, Market Rank/Share for key companies, Products and Services, and Recent Developments)
- 6.4.1 Chambal Fertilisers and Chemicals Limited
- 6.4.2 Coromandel International Limited
- 6.4.3 Gujarat Narmada Valley Fertilizers & Chemicals Limited (Govt. of Gujarat)
- 6.4.4 Haifa Negev Technologies Ltd.
- 6.4.5 ICL Group Ltd
- 6.4.6 Indian Farmers Fertiliser Cooperative Limited (IFFCO)
- 6.4.7 National Fertilizers Limited
- 6.4.8 Rashtriya Chemicals and Fertilizers Limited
- 6.4.9 Sociedad Quimica y Minera de Chile SA
- 6.4.10 Yara International ASA
- 6.4.11 Paradeep Phosphates Limited (Zuari-Maroc Phosphates Pvt. Ltd. & OCP)
- 6.4.12 Nagarjuna Fertilizers and Chemicals Limited (Nagarjuna Group)
- 6.4.13 The Fertilisers and Chemicals Travancore Limited (FACT)
- 6.4.14 Deepak Fertilisers and Petrochemicals Corporation Limited
- 6.4.15 Krishak Bharati Cooperative Limited (KRIBHCO)
7 MARKET OPPORTUNITIES AND FUTURE OUTLOOK
- 7.1 White-Space and Unmet-Need Assessment

