PUBLISHER: Mordor Intelligence | PRODUCT CODE: 2187812

PUBLISHER: Mordor Intelligence | PRODUCT CODE: 2187812
Home Decor - Market Share Analysis, Industry Trends & Statistics, Growth Forecasts (2027 - 2032)
According to Mordor Intelligence, the home decor market size is expected to increase from USD 716.5 billion in 2026 to USD 753.9 billion in 2027 and reach USD 955.3 billion by 2032, growing at a CAGR of 4.85% over 2027-2032.
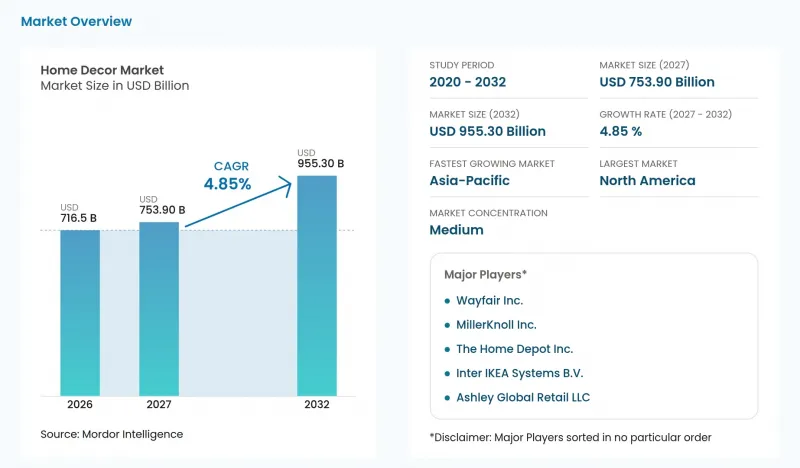
This report is segmented by Product (Floor Coverings, Furniture, and more), Distribution Channel (Specialty Stores, DIY / Mass Merchandiser, and more), Price Tier (Mass / Value, Premium, and more), and Geography (North America, Asia-Pacific, and more). The market forecasts are provided in terms of value (USD), based on availability.
Global Home Decor Market Trends and Insights
Rising consumer interest in interior design and aesthetics
Interest in refreshing a room creates a demand opportunity beyond the initial purchase of its furnishings. In a 2025 survey, 58% of adult U.S. home-furnishing buyers and planned buyers said they liked to update their home decor often. The research covered 1,200 primary or joint furniture purchase decision-makers surveyed during August 16-18, 2025. This preference gives suppliers a reason to offer design continuity between an existing interior and a new decorative purchase. A coordinated refresh can address that interest without requiring the buyer to replace the entire room. For retailers, the commercial opportunity is a sequence of compatible aesthetic updates, rather than dependence on a single complete furnishing project.
Growing influence of social media and digital platforms
Decor suppliers need to address both the creation of a room idea and the channel that completes its purchase. In Japan, 42.1% of 2,930 respondents to homebuilder Ichijo Co., Ltd.'s May 9-17, 2026, interior survey said they referred to Instagram when choosing interiors. At IKEA UK, online sales reached 43.2% of the retailer's total sales in FY25, compared with 40% in FY24. These examples place digital sources at both inspiration and transaction stages, with different commercial tasks at each. Room imagery can introduce a furnishing, while a clear buying route makes the identified product available for selection.
Raw-material price volatility
Higher material costs can restrict flooring suppliers' ability to hold selling prices while preserving manufacturing earnings. Interface's consolidated cost of sales rose USD 16.8 million in 2025, partly because of higher raw-material costs and sales volume. U.S. tariffs on imported rubber and luxury vinyl tile products added approximately USD 7.3 million to the company's costs. Lower manufacturing costs partly offset those pressures through production efficiencies and favorable fixed-cost absorption on higher volume. The combination makes material inflation commercially consequential even where greater output improves factory economics, because the offset need not remove the input burden. Flooring suppliers facing that balance must absorb the remaining cost or seek higher prices, potentially limiting demand at the affected price points.
Other drivers and restraints analyzed in the detailed report include:
- Shift toward eco-friendly and sustainable materials
- Expansion of smart-home compatible decor
- Skilled artisanal labor shortage
For complete list of drivers and restraints, kindly check the Table Of Contents.
Segment Analysis
Floor coverings accounted for a 35.45% share of the home decor market size in 2026, making it the largest segment. In 2025, carpet and area rugs represented 43.4% of the U.S. flooring market's 16.666-billion-square-foot volume. That flooring measure included residential and commercial activity, with carpet and rugs forming a substantial soft-surface category. The area-based scale highlights the commercial importance of supplying substantial physical coverage, tying decorative choice to the quantity required for an installation. Manufacturers serving that requirement can compete through the ability to deliver a consistent surface across the specified area, making production scale relevant alongside appearance.
The textiles (curtains, bedding, cushions) segment is forecast to grow fastest at a CAGR of 6.8% over 2027-2032. Dunelm Group attributed growth in the 26 weeks ended December 27, 2025, to core categories including its bedding and cushion ranges. Across the retailer's business, first-half volumes were broadly stable while average item values increased through category and product mix, rather than headline retail prices. That distinction points to assortment composition as a commercial growth mechanism even when the retailer's aggregate product volumes change little. Textile suppliers can pursue value growth through the retailer's assortment decisions, making the commercial offer broader than a commitment to higher production volume.
Complete Report Scope:
- By Product
- Furniture
- Textiles (Curtains, Bedding, Cushions)
- Floor Coverings
- Wall Decor and Accessories
- Lighting
- By Distribution Channel
- Specialty Stores
- DIY / Mass Merchandiser
- Online / E-commerce
- Interior Designers and Contractors
- By Price Tier
- Mass / Value
- Premium
- Luxury / Designer
- By Geography
- North America
- Canada
- United States
- Mexico
- South America
- Brazil
- Peru
- Chile
- Argentina
- Rest of South America
- Europe
- United Kingdom
- Germany
- France
- Spain
- Italy
- BENELUX (Belgium, Netherlands, Luxembourg)
- NORDICS (Denmark, Finland, Iceland, Norway, Sweden)
- Rest of Europe
- Asia-Pacific
- India
- China
- Japan
- Australia
- South Korea
- South East Asia (Singapore, Malaysia, Thailand, Indonesia, Vietnam, and Philippines)
- Rest of Asia-Pacific
- Middle East & Africa
- United Arab Emirates
- Saudi Arabia
- South Africa
- Nigeria
- Rest of Middle East & Africa
- North America
Geography Analysis
North America accounted for a 41.81% share of the home decor market size in 2026, making it the largest regional market. IKEA U.S. recorded 60.9 million store visits in FY25, illustrating the scale of physical retail contact within the United States. That traffic makes the retailer's sourcing relationships commercially relevant to manufacturers supplying its U.S. stores. IKEA of Sweden AB designs the range under assignment from Inter IKEA Systems B.V., and Inter IKEA Group sources most home furnishings externally, so suppliers participate through production of IKEA-designed products.
Asia-Pacific is the fastest-growing regional market, with a forecast CAGR of 7.1% over 2027-2032. In August 2025, Ingka Group launched IKEA sales on JD.com in China, offering more than 6,500 products across categories with delivery and membership services. IKEA India began online deliveries across Delhi-NCR and 9 satellite cities in March 2025, offering more than 7,000 products and solutions through app, website and phone ordering. These extensions provide a growth mechanism through additional selling access, allowing furnishing suppliers to reach households through established digital shopping routes and newly served delivery territories.
In South America, Brazil's furniture buyers faced costly credit and tighter household budgets in 2025, which weakened durable-goods demand and lengthened purchase decisions. Suppliers targeting Brazil can make financing terms part of their furniture proposition because expensive credit delays the purchase decision. Within Europe's EU countries, Malta recorded the highest furniture-and-furnishings price level in 2025, in a comparison against the EU average. In Middle East & Africa, South African household furniture, appliances and equipment retailers' seasonally adjusted sales at constant 2019 prices were 0.1% below June in July 2026.
- Inter IKEA Systems B.V.
- The Home Depot Inc.
- Wayfair Inc.
- Ashley Global Retail LLC
- MillerKnoll Inc.
- Williams-Sonoma Inc. (Pottery Barn, West Elm)
- Mohawk Industries Inc.
- Mannington Mills Inc.
- Shaw Industries Group Inc.
- La-Z-Boy Incorporated
- RH (Restoration Hardware)
- Ethan Allen Interiors Inc.
- Haverty Furniture Companies Inc.
- Crate & Barrel Holdings Inc.
- Lowe's Companies Inc.
- Walmart Inc. (Home & Living)
- Target Corporation (Threshold, Hearth & Hand)
- At Home Group Inc.
- Neighborhood Intelligence Inc.*
Additional Benefits:
- The market estimate (ME) sheet in Excel format
- 3 months of analyst support
TABLE OF CONTENTS
1 INTRODUCTION
- 1.1 Study Assumptions and Market Definition
- 1.2 Scope of the Study
2 RESEARCH METHODOLOGY
3 EXECUTIVE SUMMARY
4 MARKET LANDSCAPE
- 4.1 Market Overview
- 4.2 Market Drivers
- 4.2.1 Rising consumer interest in interior design and aesthetics
- 4.2.2 Growing influence of social media and digital platforms
- 4.2.3 Shift toward eco-friendly and sustainable materials
- 4.2.4 Expansion of smart-home compatible decor
- 4.2.5 Urban micro-living spurring multifunctional furniture
- 4.2.6 Emerging "phygital" AR/VR showroom adoption
- 4.3 Market Restraints
- 4.3.1 Raw-material price volatility
- 4.3.2 Skilled artisanal labor shortage
- 4.3.3 Costly cross-border e-commerce returns
- 4.3.4 Stricter EPR / take-back mandates
- 4.4 Industry Value Chain Analysis
- 4.5 Regulatory Landscape
- 4.6 Technological Outlook
- 4.7 Porter's Five Forces Analysis
- 4.7.1 Threat of New Entrants
- 4.7.2 Bargaining Power of Suppliers
- 4.7.3 Bargaining Power of Buyers
- 4.7.4 Threat of Substitutes
- 4.7.5 Competitive Rivalry
5 MARKET SIZE AND GROWTH FORECASTS (VALUE)
- 5.1 By Product
- 5.1.1 Furniture
- 5.1.2 Textiles (Curtains, Bedding, Cushions)
- 5.1.3 Floor Coverings
- 5.1.4 Wall Decor and Accessories
- 5.1.5 Lighting
- 5.2 By Distribution Channel
- 5.2.1 Specialty Stores
- 5.2.2 DIY / Mass Merchandiser
- 5.2.3 Online / E-commerce
- 5.2.4 Interior Designers and Contractors
- 5.3 By Price Tier
- 5.3.1 Mass / Value
- 5.3.2 Premium
- 5.3.3 Luxury / Designer
- 5.4 By Geography
- 5.4.1 North America
- 5.4.1.1 Canada
- 5.4.1.2 United States
- 5.4.1.3 Mexico
- 5.4.2 South America
- 5.4.2.1 Brazil
- 5.4.2.2 Peru
- 5.4.2.3 Chile
- 5.4.2.4 Argentina
- 5.4.2.5 Rest of South America
- 5.4.3 Europe
- 5.4.3.1 United Kingdom
- 5.4.3.2 Germany
- 5.4.3.3 France
- 5.4.3.4 Spain
- 5.4.3.5 Italy
- 5.4.3.6 BENELUX (Belgium, Netherlands, Luxembourg)
- 5.4.3.7 NORDICS (Denmark, Finland, Iceland, Norway, Sweden)
- 5.4.3.8 Rest of Europe
- 5.4.4 Asia-Pacific
- 5.4.4.1 India
- 5.4.4.2 China
- 5.4.4.3 Japan
- 5.4.4.4 Australia
- 5.4.4.5 South Korea
- 5.4.4.6 South East Asia (Singapore, Malaysia, Thailand, Indonesia, Vietnam, and Philippines)
- 5.4.4.7 Rest of Asia-Pacific
- 5.4.5 Middle East & Africa
- 5.4.5.1 United Arab Emirates
- 5.4.5.2 Saudi Arabia
- 5.4.5.3 South Africa
- 5.4.5.4 Nigeria
- 5.4.5.5 Rest of Middle East & Africa
- 5.4.1 North America
6 COMPETITIVE LANDSCAPE
- 6.1 Market Concentration
- 6.2 Strategic Moves
- 6.3 Market Share Analysis
- 6.4 Company Profiles (includes Global level Overview, Market level overview, Core Segments, Financials as available, Strategic Information, Market Rank/Share for key companies, Products and Services, and Recent Developments)
- 6.4.1 Inter IKEA Systems B.V.
- 6.4.2 The Home Depot Inc.
- 6.4.3 Wayfair Inc.
- 6.4.4 Ashley Global Retail LLC
- 6.4.5 MillerKnoll Inc.
- 6.4.6 Williams-Sonoma Inc. (Pottery Barn, West Elm)
- 6.4.7 Mohawk Industries Inc.
- 6.4.8 Mannington Mills Inc.
- 6.4.9 Shaw Industries Group Inc.
- 6.4.10 La-Z-Boy Incorporated
- 6.4.11 RH (Restoration Hardware)
- 6.4.12 Ethan Allen Interiors Inc.
- 6.4.13 Haverty Furniture Companies Inc.
- 6.4.14 Crate & Barrel Holdings Inc.
- 6.4.15 Lowe's Companies Inc.
- 6.4.16 Walmart Inc. (Home & Living)
- 6.4.17 Target Corporation (Threshold, Hearth & Hand)
- 6.4.18 At Home Group Inc.
- 6.4.19 Neighborhood Intelligence Inc.*
7 MARKET OPPORTUNITIES AND FUTURE OUTLOOK
- 7.1 White-Space and Unmet-Need Assessment

