
Need help finding what you are looking for?
Contact Us
PUBLISHER: Mordor Intelligence | PRODUCT CODE: 1686218

PUBLISHER: Mordor Intelligence | PRODUCT CODE: 1686218
North America Ice Cream - Market Share Analysis, Industry Trends & Statistics, Growth Forecasts (2025 - 2030)
PUBLISHED:
PAGES: 173 Pages
DELIVERY TIME: 2-3 business days
SELECT AN OPTION
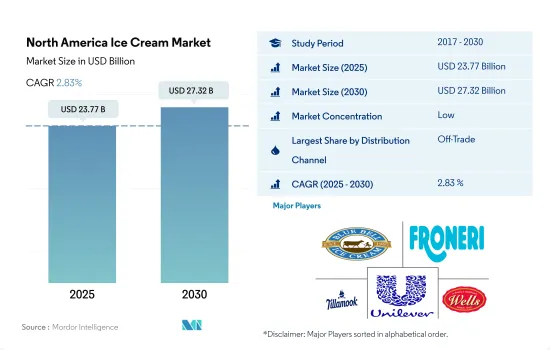
The North America Ice Cream Market size is estimated at 23.77 billion USD in 2025, and is expected to reach 27.32 billion USD by 2030, growing at a CAGR of 2.83% during the forecast period (2025-2030).
Increasing demand for live shopping experience among consumers is boosting the retailing business
- The distribution channel of the North American region is bifurcated into on-trade and off-trade retailing chambers. The off-trade segment witnessed a growth of 2.4% in 2022 compared with the previous year, 2021. The growth in off-trade channels is related to the shopping facility that it provides to its consumers. The supermarket and hypermarkets provide ice cream at different prices, which range from USD 4.84 and go up to more than USD 140. The easy availability of ice creams at different prices also surges the buying power of consumers. In addition to this, seeking the rising demand for ice cream and convenient shopping options among consumers, the off-trade retailing segment's retail value of the distribution channel sector is estimated to grow by 4.01% in 2025.
- After the COVID-19 outbreak, consumers have started preferring out-home consumption. As a result of this, the demand for the food chains segment and food service retailers increased by 2.4% in 2022. Some of the famous ice cream food service chains in the North American region are Baskin-Robbins, Ben and Jerry, etc. These retailers provide ice cream in different flavors, including chocolate, vanilla, and strawberry, among others.
- In North America, online retailing sectors also witnessed growth in their retail value by 2.56% in 2022. These online retailers offer a wide range of products with varied ingredients, brands, flavors, etc. Online retailers are captivating the focus of consumers towards e-commerce shopping by offering them a variety of offers. Seeking quick buying options for ice cream, the consumption value of ice cream increased by 5.48% when compared to the preceding year, 2020.
Strong availability of various flavors coupled with well penetrated retail channels market market to grow
- The ice cream industry in the North American region witnessed a growth of 2.40% in 2022 compared to 2021. It is anticipated to grow with the rising availability of a variety of flavors in this segment. In order to captivate the focus of consumers, manufacturers are selling ice cream in different formats, including low-fat and fat-free ice creams. This has led to an increased interest in ice cream products as people seek to maintain a healthy diet. Seeking the demand for ice cream products, the ice cream industry is expected to grow by 3.2% in 2024.
- In the North American region, the United States is dominating the ice cream industry. In 2022, the US held a share of 70.08%. In January 2023, there were 150,174 convenience stores operating in the United States, which was a rise of 1.5% from the 2022 store count. This helps consumers purchase ice cream products.
- Canada held a share of 18.85%. Texas has the most convenience stores, with 16,018 stores, which is followed by California, with 12,000 stores. Some of the famous stores in the North American region are Walmart, Amazon, Kroger, and Target, among others. These stores offer a wide variety of ice cream products in the market.
- Mexico held a share of 51.02%. In 2020, there were 33 supermarket chains, with 3,227 stores, 2,365 department stores, and 53,793 specialized stores throughout the country. Around 50% of the retail market is covered by informal establishments, such as mobile street vendors and open public markets. Ice cream products are also available at varied prices (low, medium, and high). The base selling price of packaged milk is USD 1.72, which goes as high as USD 50.5. The availability of these products at various price ranges promotes buying power among the population.
North America Ice Cream Market Trends
The availability of various flavors of ice cream products is one of the factors driving consumption in North America
- The ice cream segment is gaining significant popularity among consumers in the North American region, primarily due to the availability of a wide range of flavors. Popular flavors include chocolate, cookies and cream, vanilla, and strawberry. The vanilla flavor is preferred by 36.87% of consumers, while chocolate is preferred by 25.42% of the population. In 2022, the segment witnessed a growth of 7.6% compared to 2021. On average, an American consumes approximately 10 kg of ice cream and related frozen desserts per year. Regular ice cream is the most popular category of frozen desserts.
- The total milk solids component of ice cream includes both fat and other solids. These milk solids include the protein and lactose levels in milk and range from 9% to 12% in ice cream. This has resulted in a rise in per capita consumption over the years, which increased by 2.21% from 2020 to 2023. In Mexico, the forecast for milk production in 2023 is 13.42 million metric tons (MMT), a growth of 2% from 2022, as producers continue to thrive despite both high domestic inflation and feed prices.
- In North America, ice creams are available at a price ranging from USD 4.97 to more than USD 87.2. In Mexico, the average price for fluid milk paid on the farm was MXN 7.80 (USD 0.39) per liter as of June 2022. This price reflects a 1.3% increase compared to the previous month and a 12.6% increase compared to June 2021. The wholesale price of milk in Mexico was MXN 17.64 (USD 0.88) per liter, representing a 1.6% increase compared to May 2021 and a 14.5% increase compared to the previous year. The average price paid by consumers is currently MXN 22.02 (USD 1.1) per liter, showing a 0.22% increase compared to May 2022 and a 9.6% increase compared to June 2021.
North America Ice Cream Industry Overview
The North America Ice Cream Market is fragmented, with the top five companies occupying 32.72%. The major players in this market are Blue Bell Creameries LP, Froneri International Limited, Tillamook CCA, Unilever PLC and Wells Enterprises Inc. (sorted alphabetically).
Additional Benefits:
- The market estimate (ME) sheet in Excel format
- 3 months of analyst support
Product Code: 50681
TABLE OF CONTENTS
1 EXECUTIVE SUMMARY & KEY FINDINGS
2 REPORT OFFERS
3 INTRODUCTION
- 3.1 Study Assumptions & Market Definition
- 3.2 Scope of the Study
- 3.3 Research Methodology
4 KEY INDUSTRY TRENDS
- 4.1 Per Capita Consumption
- 4.2 Raw Material/commodity Production
- 4.2.1 Milk
- 4.3 Regulatory Framework
- 4.3.1 Canada
- 4.3.2 Mexico
- 4.3.3 United States
- 4.4 Value Chain & Distribution Channel Analysis
5 MARKET SEGMENTATION (includes market size in Value in USD and Volume, Forecasts up to 2030 and analysis of growth prospects)
- 5.1 Distribution Channel
- 5.1.1 Off-Trade
- 5.1.1.1 By Sub Distribution Channels
- 5.1.1.1.1 Convenience Stores
- 5.1.1.1.2 Online Retail
- 5.1.1.1.3 Specialist Retailers
- 5.1.1.1.4 Supermarkets and Hypermarkets
- 5.1.1.1.5 Others (Warehouse clubs, gas stations, etc.)
- 5.1.2 On-Trade
- 5.1.1 Off-Trade
- 5.2 Country
- 5.2.1 Canada
- 5.2.2 Mexico
- 5.2.3 United States
- 5.2.4 Rest of North America
6 COMPETITIVE LANDSCAPE
- 6.1 Key Strategic Moves
- 6.2 Market Share Analysis
- 6.3 Company Landscape
- 6.4 Company Profiles (includes Global Level Overview, Market Level Overview, Core Business Segments, Financials, Headcount, Key Information, Market Rank, Market Share, Products and Services, and Analysis of Recent Developments).
- 6.4.1 Agropur Dairy Cooperative
- 6.4.2 Arla Foods amba
- 6.4.3 Blue Bell Creameries LP
- 6.4.4 Chapman's
- 6.4.5 Froneri International Limited
- 6.4.6 Prairie Farms Dairy Inc.
- 6.4.7 Tillamook CCA
- 6.4.8 Turkey Hill Dairy
- 6.4.9 Unilever PLC
- 6.4.10 Wells Enterprises Inc.
- 6.4.11 Yasso Inc.
7 KEY STRATEGIC QUESTIONS FOR DAIRY AND DAIRY ALTERNATIVE CEOS
8 APPENDIX
- 8.1 Global Overview
- 8.1.1 Overview
- 8.1.2 Porter's Five Forces Framework
- 8.1.3 Global Value Chain Analysis
- 8.1.4 Market Dynamics (DROs)
- 8.2 Sources & References
- 8.3 List of Tables & Figures
- 8.4 Primary Insights
- 8.5 Data Pack
- 8.6 Glossary of Terms
Have a question?


SELECT AN OPTION
Have a question?
Questions? Please give us a call or visit the contact form.