
PUBLISHER: Mordor Intelligence | PRODUCT CODE: 1906948

PUBLISHER: Mordor Intelligence | PRODUCT CODE: 1906948
Biostimulants - Market Share Analysis, Industry Trends & Statistics, Growth Forecasts (2026 - 2031)
The biostimulants market was valued at USD 4.5 billion in 2025 and estimated to grow from USD 4.94 billion in 2026 to reach USD 7.91 billion by 2031, at a CAGR of 9.85% during the forecast period (2026-2031).
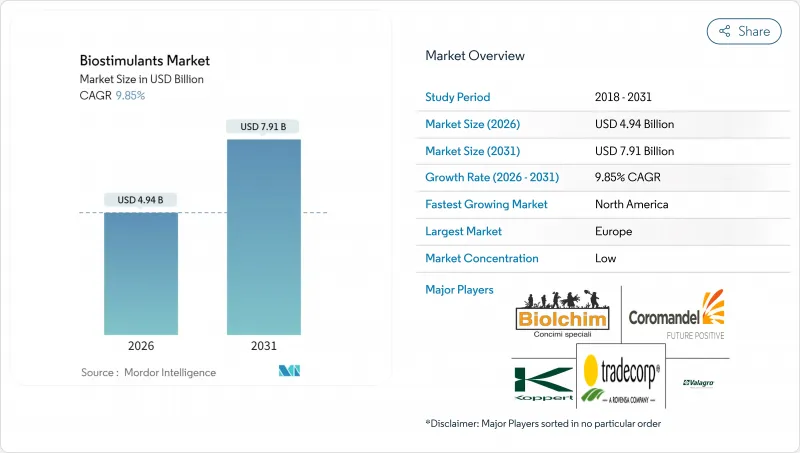
Surging demand for sustainable crop inputs, growing alignment of regulatory definitions, and mounting evidence linking biologicals with yield stability are anchoring this momentum. Farmers are integrating biostimulants with conventional fertility programs to widen stress-tolerance ranges and qualify for emerging carbon-credit schemes, while manufacturers accelerate product launches that pair microbial consortia with amino and humic acids for broader compatibility. Europe continues to serve as the innovation hub because of early regulatory clarity, although North America now records the sharpest deployment curve under the United States Department of Agriculture Climate-Smart Commodities Partnership, which reimburses up to 75% of field-level application costs. Global expansion is further supported by the Association of American Plant Food Control Officials' initiative that standardizes registration pathways across the United States jurisdictions, cutting approval times by nearly one-third.
Global Biostimulants Market Trends and Insights
Growing demand for organic food products
Organic acreage in the United States is continuously expanding, confirming consumer willingness to pay premiums for produce cultivated with biological inputs. Europe's Farm to Fork framework, which targets 25 % organic farmland by 2030, quickens biostimulant uptake among producers seeking to safeguard yields during transition periods. National Organic Program guidance now lists approved biostimulant categories, clearing prior ambiguity around certification. Parallel surges in specialty retail channels strengthen price realization, driving farm-level return on investment for high-purity amino and seaweed extracts.
Government subsidies and supportive regulations
The Climate-Smart Commodities Partnership sets aside significant fund for sustainable practice reimbursements, with eligible growers recouping as much as 75 % of biostimulant costs. California's Healthy Soils Program layers additional cost-share grants. On the industry side, the Association of American Plant Food Control Officials harmonized state-by-state definitions, trimming redundant data filing steps for manufacturers and expediting product rollouts. Similar alignment across Europe's Common Agricultural Policy eco-schemes allows farmers to claim payments after integrating biostimulants into nutrient-management plans.
Heterogeneous regulatory definitions
Outside the European Union, many jurisdictions still file biostimulants under pesticide statutes, adding toxicological data requirements that inflate compliance costs. Countries in Southeast Asia and Africa often lack dedicated review committees, delaying market entry by up to two seasons. Pending International Organization for Standardization workstreams aim to deliver global guidelines, yet implementation timelines stretch beyond 2027.
Other drivers and restraints analyzed in the detailed report include:
- Sustainability-driven grower adoption
- Yield and abiotic-stress improvement evidence
- Low farmer awareness and efficacy skepticism
For complete list of drivers and restraints, kindly check the Table Of Contents.
Segment Analysis
Amino acids captured 30.62 % of 2025 revenue, confirming their widespread acceptance in fertigation and foliar programs addressing abiotic stress in high-value horticulture. Comparative returns of USD 40 - 80 per acre offset input costs of USD 15 - 25, encouraging continuous application in tomato, pepper, and cucumber systems. Compatibility with drip irrigation chemistries and proven shelf stability underpin loyalty among protected-crop producers. Horticultural integrators also favor amino acids when seeking to meet National Organic Program rules because most enzymatic hydrolysis routes qualify under organic processing standards. Water-soluble humic acids remain the breakout subcategory, projected to register a 12.45 % CAGR through 2031. Soil-conditioning mechanisms that chelate micronutrients and improve cation-exchange capacity resonate with corn and soybean growers focused on root-zone health.
Manufacturers highlight cross-compatibility with conventional urea ammonium nitrate solutions to expand usage in mainstream row crops. Improved prill coating technologies deliver uniform particle size, avoiding equipment blockages that once hindered use. Protein hydrolysates continue to build share in certified organic chains, where animal-derived amino blends contribute nitrogen and carbon in a single pass. Seaweed extracts, although still integral, face supply volatility that encourages synthetic analog development using precision fermentation. Fulvic acids are gaining loyalty among precision farmers deploying variable-rate sprayers because their lower molecular weight supports rapid tissue infiltration, allowing consistent response monitoring through multispectral drone imagery.
The Biostimulants Market Report is Segmented by Form (Amino Acids, Fulvic Acid, Humic Acid, and More), Crop Type (Cash Crops, Horticultural Crops, and Row Crops), and Geography (North America, South America, Europe, and More). The Market Forecasts are Provided in Terms of Value (USD) and Volume (Metric Tons).
Geography Analysis
Europe retained 38.62 % value share in 2025 on the back of a mature regulatory infrastructure and comprehensive subsidies within the Common Agricultural Policy eco-scheme. Producers in the Netherlands use fertigation-compatible humic acids to cut nitrate leaching fines while safeguarding yield ceilings. Danish arable farms leverage the 25 % organic land goal to secure bank loans at preferential rates, provided that biostimulants feature in nutrient plans, thereby tying financial incentives to biological adoption. Eastern European producers in Poland and Romania benefit from knowledge transfer and funding via Rural Development Program pillars, positioning the bloc for continued leadership.
North America registers the highest growth curve at 12.35 % CAGR by 2031. The United States Department of Agriculture partnership grants draw corporate aggregators such as Archer Daniels Midland to sponsor multistate pilot projects, encouraging acreage alignment. Universities, including Iowa State and Kansas State, deliver open-access field trial datasets that de-risk farm-level experiments, accelerating diffusion in the Corn Belt. Canada's Sustainable Agriculture Strategy mirrors these incentives, enabling wheat and canola growers to qualify for greenhouse-gas offset protocols when switching from synthetic growth regulators to biological enhancers.
Asia-Pacific demonstrates layered potential. China's domestic biological-agriculture directive lists biostimulants as strategic inputs, but fragmented provincial oversight slows homogeneous deployment. India's organic transfer schemes boost demand in high-value basmati rice and mango exports, yet supply of high-purity raw materials remains uneven. South America gains traction largely in Brazil, where soybean producers adopt humic acids to manage aluminum toxicity in acid soils. Argentina's no-till systems integrate microbial seed coatings as part of wider regenerative packages. Middle East and Africa stay nascent, though irrigation-constrained horticulture in Israel and Morocco begins to explore fulvic acid root-drench protocols to mitigate salinity.
- Valagro (Syngenta Group)
- Trade Corporation International ( Rovensa Group )
- Atlantica Agricola S.A.
- Agriculture Solutions Inc.
- Biolchim SpA ( J. M. Huber Corporation )
- Coramandel International Limited
- UPL Ltd.
- BASF SE
- Bayer AG
- FMC Corporation
- Koppert Group
- Gowan Company
- Haifa Group ( Trance Resource Minerals Pte. )
- BioAtlantis Ltd.
Additional Benefits:
- The market estimate (ME) sheet in Excel format
- 3 months of analyst support
TABLE OF CONTENTS
1 INTRODUCTION
- 1.1 Study Assumptions and Market Definition
- 1.2 Scope of the Study
- 1.3 Research Methodology
2 REPORT OFFERS
3 EXECUTIVE SUMMARY AND KEY FINDINGS
4 KEY INDUSTRY TRENDS
- 4.1 Area Under Organic Cultivation
- 4.2 Per Capita Spending on Organic Products
- 4.3 Regulatory Framework
- 4.3.1 Argentina
- 4.3.2 Australia
- 4.3.3 Brazil
- 4.3.4 Canada
- 4.3.5 China
- 4.3.6 Egypt
- 4.3.7 France
- 4.3.8 Germany
- 4.3.9 India
- 4.3.10 Indonesia
- 4.3.11 Italy
- 4.3.12 Japan
- 4.3.13 Mexico
- 4.3.14 Netherlands
- 4.3.15 Nigeria
- 4.3.16 Philippines
- 4.3.17 Russia
- 4.3.18 South Africa
- 4.3.19 Spain
- 4.3.20 Thailand
- 4.3.21 Turkey
- 4.3.22 United Kingdom
- 4.3.23 United States
- 4.3.24 Vietnam
- 4.4 Value Chain and Distribution Channel Analysis
- 4.5 Market Drivers
- 4.5.1 Growing demand for organic food products
- 4.5.2 Government subsidies and supportive regulations
- 4.5.3 Sustainability-driven grower adoption
- 4.5.4 Yield and abiotic-stress improvement evidence
- 4.5.5 Seed-coating and micronutrient blend integration
- 4.5.6 Carbon-credit monetization potential
- 4.6 Market Restraints
- 4.6.1 Heterogeneous regulatory definitions
- 4.6.2 Low farmer awareness and efficacy skepticism
- 4.6.3 Competition from microbial inoculants and biofertilizers
- 4.6.4 Seaweed raw-material supply risk
5 MARKET SIZE AND GROWTH FORECASTS (VALUE AND VOLUME)
- 5.1 Form
- 5.1.1 Amino Acids
- 5.1.2 Fulvic Acid
- 5.1.3 Humic Acid
- 5.1.4 Protein Hydrolysates
- 5.1.5 Seaweed Extracts
- 5.1.6 Other Biostimulants
- 5.2 Crop Type
- 5.2.1 Cash Crops
- 5.2.2 Horticultural Crops
- 5.2.3 Row Crops
- 5.3 Geography
- 5.3.1 Africa
- 5.3.1.1 By Country
- 5.3.1.1.1 Egypt
- 5.3.1.1.2 Nigeria
- 5.3.1.1.3 South Africa
- 5.3.1.1.4 Rest of Africa
- 5.3.1.1 By Country
- 5.3.2 Asia-Pacific
- 5.3.2.1 By Country
- 5.3.2.1.1 Australia
- 5.3.2.1.2 China
- 5.3.2.1.3 India
- 5.3.2.1.4 Indonesia
- 5.3.2.1.5 Japan
- 5.3.2.1.6 Philippines
- 5.3.2.1.7 Thailand
- 5.3.2.1.8 Vietnam
- 5.3.2.1.9 Rest of Asia-Pacific
- 5.3.2.1 By Country
- 5.3.3 Europe
- 5.3.3.1 By Country
- 5.3.3.1.1 France
- 5.3.3.1.2 Germany
- 5.3.3.1.3 Italy
- 5.3.3.1.4 Netherlands
- 5.3.3.1.5 Russia
- 5.3.3.1.6 Spain
- 5.3.3.1.7 Turkey
- 5.3.3.1.8 United Kingdom
- 5.3.3.1.9 Rest of Europe
- 5.3.3.1 By Country
- 5.3.4 Middle East
- 5.3.4.1 By Country
- 5.3.4.1.1 Iran
- 5.3.4.1.2 Saudi Arabia
- 5.3.4.1.3 Rest of Middle East
- 5.3.4.1 By Country
- 5.3.5 North America
- 5.3.5.1 By Country
- 5.3.5.1.1 Canada
- 5.3.5.1.2 Mexico
- 5.3.5.1.3 United States
- 5.3.5.1.4 Rest of North America
- 5.3.5.1 By Country
- 5.3.6 South America
- 5.3.6.1 By Country
- 5.3.6.1.1 Argentina
- 5.3.6.1.2 Brazil
- 5.3.6.1.3 Rest of South America
- 5.3.6.1 By Country
- 5.3.1 Africa
6 COMPETITIVE LANDSCAPE
- 6.1 Key Strategic Moves
- 6.2 Market Share Analysis
- 6.3 Company Landscape
- 6.4 Company Profiles (Includes Global Level Overview, Market Level Overview, Core Segments, Financials as available, Strategic Information, Market Rank/Share, Products and Services, and Recent Developments)
- 6.4.1 Valagro (Syngenta Group)
- 6.4.2 Trade Corporation International ( Rovensa Group )
- 6.4.3 Atlantica Agricola S.A.
- 6.4.4 Agriculture Solutions Inc.
- 6.4.5 Biolchim SpA ( J. M. Huber Corporation )
- 6.4.6 Coramandel International Limited
- 6.4.7 UPL Ltd.
- 6.4.8 BASF SE
- 6.4.9 Bayer AG
- 6.4.10 FMC Corporation
- 6.4.11 Koppert Group
- 6.4.12 Gowan Company
- 6.4.13 Haifa Group ( Trance Resource Minerals Pte. )
- 6.4.14 BioAtlantis Ltd.
7 KEY STRATEGIC QUESTIONS FOR AGRICULTURAL BIOLOGICALS CEOS

