
PUBLISHER: Marketstrat, Inc. | PRODUCT CODE: 2008697

PUBLISHER: Marketstrat, Inc. | PRODUCT CODE: 2008697
Global Ultrasound Horizon: Market Structure, Forecasts, and AI Monetization Architecture (2024A-2035E)
Report Overview
This Horizon report is Marketstrat's in-depth global analysis of the ultrasound market and broader ultrasound ecosystem - built for ultrasound OEM executives, strategy and corporate development teams, services / aftermarket leaders, providers, investors, and AI/workflow vendors adjacent to imaging. The report integrates ultrasound hardware, installed-base economics, service / aftermarket revenue, core AI recurring revenue, the broader AI bridge, market-structure views, competitive architecture, and strategic frameworks into one reconciled decision model.
Unlike conventional ultrasound reports that treat AI as an add-on chapter, this report treats AI as a first-class commercialization layer across acquisition guidance, reporting, quantification, cloud orchestration, enterprise governance, and recurring monetization. The goal is not just to describe the market - it is to explain where value is forming, how it is being monetized, how competition is reorganizing, and which commercial moves matter most over the next decade.
Market Snapshot
Ultrasound is broadening faster than it is premiumizing. World systems revenue rises from $9.6B in 2024A to $16.4B in 2035E, while annual shipments increase from 204,183 to 480,331 units and installed base expands from 1.15M to 1.90M units. That means the market is adding many more devices into many more settings than a simple topline revenue view suggests.
The more important structural shift sits above hardware. Total ecosystem revenue grows from $12.5B to $21.5B, while service + core AI recurring rises from $2.9B to $5.2B and the broader AI bridge expands from $593.6MM to $4.3B. In other words, the next value pool is increasingly tied to workflow, reporting, governance, cloud review, and software-linked operating leverage rather than to hardware ASP alone.
Key Takeaways
- The global ultrasound ecosystem expands from $12.5B (2024A) to $21.5B (2035E), as the market broadens beyond hardware into service, workflow, and AI-linked monetization.
- Ultrasound is entering a structural two-speed transition: premium and midrange carts remain the value core, while compact / portable and handheld / POCUS expand the addressable user base and site-of-care footprint.
- The AI layer is not a feature checklist - it is a monetization architecture shift. The broader AI bridge grows from $593.6MM to $4.3B, with increasing value moving toward software, cloud / PPU, services, workflow, and governance.
- Marketstrat structures ultrasound competition through a cluster-based ecosystem architecture and applies the full Markintel-TM framework stack to translate sizing into actionable GTM, packaging, and partnership priorities
Key Market Trends (What is Structurally Changing)
- Compact / Portable becomes the main hardware growth engine. It rises from 29.6% of systems revenue in 2024A to 37.2% in 2035E and becomes the largest single hardware segment.
- Handheld / POCUS becomes the main access-expansion engine. It remains smaller in revenue than carts, but its shipment share expands from 19.2% to 38.9%, signaling a major shift in where and by whom ultrasound is used.
- The market is becoming more software-defined. The report's central thesis is that value is migrating above the probe into acquisition guidance, structured reporting, QA, governance, cloud review, and enterprise workflow insertion.
- Regional growth and monetization are diverging. North America remains the largest revenue pool, Europe remains an installed-base and recurring-rich market, APAC is the fastest-growing major region and biggest long-run scale reservoir, while LATAM and MEA remain smaller but strategically important for portability, value-tier positioning, and service-network execution.
- China now requires a separate strategy. The report treats China as a distinct competitive system shaped by procurement, domestic substitution, local AI, value-tier scale, and export ambition rather than as just another regional sub-market.
Competitive Landscape (Cluster-Based Ecosystem Architecture)
Marketstrat structures the ultrasound ecosystem into clusters to clarify where value is captured and who controls distribution, workflow, and monetization. The report organizes the market into:
- Systems OEMs / platform incumbents
- Portable / compact / POCUS hardware
- Handheld / home-use ultrasound
- AI acquisition / interpretation / workflow / decision support
- Frontier / wearable / hybrid / therapeutic
- Semiconductor / transducer / infrastructure / enabling technology
- China-specific vendors / local ecosystem
Within and across those clusters, the report explains:
- where the moat sits (distribution vs workflow vs platform control),
- how revenue is captured (bundle vs attach vs enterprise subscription vs cloud / PPU vs services),
- and what to watch over the next 12-24 months. The report specifically identifies GE HealthCare, Philips, Mindray, Samsung Medison, Siemens Healthineers, Canon Medical, FUJIFILM Sonosite, Butterfly Network, Clarius, Exo, UltraSight, BrightHeart, Sonio, Us2.ai, AS Software, SonoScape, and more than 60 additional ecosystem participants.
Companies Discussed
AISAP, AS Software, ASUS LU800, Biotics AI, Boston Scientific, Brainsonix, BrightHeart, Butterfly Network, Canon Medical Systems, Caption Health, Carthera, Chison, Clarius Mobile Health, DeepHealth / See-Mode, DeepSight Technology, DiA Imaging Analysis, Diagnoly, DolphinSonic, EchoNous, EndoSound, Esaote, ESI, Evident Vascular, EXACT Therapeutics, Exo, Fiyano, Flosonics Medical, FUJIFILM / FUJIFILM Sonosite, GE HealthCare, Gestalta, Healcerion, HeartFocus / DESKi, HeartLab, HistoSonics, Hitachi, Huasheng Medical, iCAD, imec, Infineon Technologies, Intelerad Medical Systems, Intelligent Ultrasound / Surgical Science, iSono Health, Koios Medical, Konica Minolta, Laza Medical, MAUI Imaging, MediReport, Merge Labs, MicroPort Lifesciences, Mindray, MyCardium AI, NerveBlox, NICAMED, NVIDIA, Openwater, Oxailis, OxSonics Therapeutics, Petal Surgical, Philips, PIUR Imaging, Pulsenmore, Qure.ai, RadNet / DeepHealth, Resolve Stroke, Rivanna Medical, Samsung Medison, Sanmai Technologies, SecondWave Systems, Seno Medical, Shantou Ultrasound / SIUI, Siemens Healthineers, Softsonics, SonALAsense, Sonic Incytes, Sonio, SonoScape, Sonus Microsystems, SuperSonic Imagine, ThinkSono, TodoPocus, TRS Technologies, TSMC, TTP, UltraSight, Ultrasound AI, Ultromics, United Imaging Healthcare, Us2.ai, Vave Health, Ventripoint Diagnostics, Verasonics, Vermon, Wandong Medical
Methodology & Frameworks
The report is built on Marketstrat's Markintel-TM Horizon methodology, combining:
- a reconciled core market model,
- an AI bridge that clarifies embedded vs recurring vs cloud/consumption economics,
- and publishable market-structure views that reconcile back to the same totals.
The full Horizon framework stack is applied as an insight-to-action engine, including:
- M3 Market Momentum Matrix
- M TEM
- T DIC
- Solution Adoption & Growth Matrix
- Use-Case Monetization Map
- ARC-Index
- Ecosystem Collaboration Matrix
- Partnering Decision Tree
- Upgrade & Package Ladder
- AI Revenue Bridge
What's Covered
- Core global model (2024A-2035E): systems revenue, service / aftermarket, core AI recurring, installed base, unit shipments, and AI bridge value pools.
- Hardware segmentation: premium cart, midrange cart, value cart, compact / portable console, handheld / POCUS.
- Standardized geography model: North America (U.S., Canada), Europe (Germany, France, UK, Italy, ROE), APAC (China, Japan, India, ROAPAC), LATAM, MEA.
- Market Structure Views: end-market mix, clinical application mix, purchase model mix, operating model mix, AI capability mix.
- Competitive landscape: cluster-based architecture plus company spotlights.
- Commercial architecture: packaging logic, partnership motion, AI monetization architecture, and report-facing implications-to-action.
TABLE OF CONTENTS
SECTION 1 - EXECUTIVE SUMMARY
- 1.1 Executive Takeaways
- 1.2 Executive Summary Dashboard
- 1.3 Global Market At-a-Glance (Core Model)
- 1.4 The AI Layer: Where Monetization Shifts
- 1.5 Market Structure: What Is Structurally Changing
- 1.6 Competitive Landscape at-a-Glance
- Ultrasound Market Competitive Landscape at-a-Glance - Executive View
- 1.7 Implications-to-Action (Executive Actions)
- 1.8 Signals to Watch (Next 12-24 Months)
SECTION 2 - METHODOLOGY
- 2.1 What This Report Is-and What It Is Not
- 2.2 Research Foundation and How Sources Are Used
- Methodology - Standardized Source Stack and Usage Rules
- 2.3 Methodology Architecture - Ultrasound Horizon Program
- 2.4 Market Definition and Segmentation Schema
- Market Coverage - Standardized Geography Map
- Core Ultrasound Hardware Segmentation Schema
- 2.5 Research Workflow - Ultrasound Horizon Program
- 2.6 Core Market Sizing & Forecasting Methodology (2024A-2035E)
- Ultrasound - Core Modeled Outputs and Report-Facing Conventions
- 2.7 AI Layer Methodology: Core Recurring vs Total AI Bridge
- Ultrasound AI Layer Methodology - What Sits Where, And Why
- 2.8 Non-Model Market Structure Views Methodology
- Ultrasound Non-Model Market Structure Views - What They Do and Why They Are Derived, Not Independently Forecast
- 2.9 Competitive Landscape Methodology
- Ultrasound Competitive Clustering and Spotlight Methodology
- 2.10 Strategic Frameworks: How the Horizon Framework Stack Converts Model Output into Action
- Ultrasound Horizon Framework Stack - From Question to Action
- 2.11 QA, Reconciliation, and Reproducibility
- Ultrasound Research - QA, Reconciliation, and Reproducibility
- 2.12 Limitations and Guidance for Interpretation
- Interpretation Guardrails - How to Read the Output Correctly
SECTION 3 - STRATEGIC FRAMEWORKS & MARKET ANALYSIS
- 3.1 World Ultrasound Market Overview (Modeled Core)
- 3.2 World Ultrasound Market - Non-Model Analysis (Market Structure Views)
- End-Market Mix
- Clinical Application Mix
- Purchase Model Mix
- Operating Model Mix
- AI Capability Mix
- 3.3 Strategic Frameworks Architecture - Ultrasound Horizon Program
- Included Frameworks and Ultrasound-Specific Adaptation
- 3.4 M3 Market Momentum Matrix (Global Ultrasound)
- 3.5 M-TEM (Technology Maturity Scoring)
- M-TEM Scorecard - Ultrasound Technology Stack
- 3.6 Ultrasound AI Revenue by Stream (Bridge View)
- 3.7 T-DIC (Technology Diffusion & Impact Curve)
- T-DIC - Priority Ultrasound Technology Transitions
- 3.8 Solution Adoption & Growth Matrix
- Solution Adoption & Growth Matrix - Ultrasound AI / Workflow Use Cases
- 3.9 Ultrasound AI Use-Case Monetization Architecture
- Ultrasound AI Use-Case Monetization Map
- 3.10 GTM Growth-Maturity Matrix - Ultrasound Ecosystem (Selected)
- GTM Growth-Maturity Matrix - Selected Ultrasound Ecosystem Players
- 3.11 Ecosystem Collaboration - Ultrasound Ecosystem
- Ecosystem Collaboration Matrix - Ultrasound
- Ecosystem Collaboration - Partner Archetype and Why It Matters
- Control Plane Map - Distribution vs Workflow
- 3.12 Partnering Decision Tree
- Partnering Decision Tree - Recommended Commercialization Motion by Starting Position
- 3.13 ARC-Index (Approvals, Reimbursement/ROI, Clinical Validation)
- ARC-Index - Ultrasound AI Capabilities
- 3.14 Ultrasound Upgrade & Package Ladder
- Ultrasound Upgrade & Package Ladder - Selected Commercial Tiers
- 3.15 Ultrasound AI Revenue Bridge
SECTION 4 - COMPETITIVE LANDSCAPE & COMPANY SPOTLIGHT
- 4.1 Cross-Cutting Competitive Thesis
- 4.2 Competitive Landscape Map - Ultrasound Ecosystem (Clusters & Sub-Clusters)
- Ultrasound Competitive Landscape Map - Clusters and Sub-Clusters
- Competitive Signal Scorecard
- Competitive Signal Scorecard - Selected High-Impact Companies
- Global Systems OEM Share Bands (2024A, Global; Directional)
- Ultrasound systems regional share bands (2024A, global; directional)
- 4.3 Cluster 1 - Systems OEMs / Platform Incumbents
- Cluster Landscape (How Competition Works)
- Company Spotlights
- GE HealthCare
- Philips
- Siemens Healthineers
- Samsung Medison
- Mindray
- Canon Medical Systems
- FUJIFILM / FUJIFILM Sonosite
- SonoScape
- Esaote
- United Imaging Healthcare
- Hitachi (legacy ultrasound franchise)
- 4.4 Cluster 2 - Portable / Compact / POCUS Hardware
- Cluster Landscape (How Competition Works)
- Company Spotlights
- EchoNous
- Exo
- FUJIFILM Sonosite
- GE HealthCare (Venue / Vscan family)
- Mindray (TE / M / Z families; TE Air adjacency)
- Philips (Lumify / compact CV / shared-service systems)
- Samsung Medison
- Canon Medical
- Esaote
- Chison
- Fiyano
- TodoPocus
- Rivanna Medical
- Vave Health
- ASUS LU800
- 4.5 Cluster 3 - Handheld / Home-Use Ultrasound
- Cluster landscape (how competition works)
- Company Spotlights
- Butterfly Network
- Clarius Mobile Health
- Exo
- Pulsenmore
- GE HealthCare (Vscan Air)
- Mindray (TE Air)
- Healcerion
- ASUS LU800
- Vave Health
- TodoPocus
- 4.6 Cluster 4 - AI Acquisition / Interpretation / Workflow / Decision Support
- Cluster landscape (how competition works)
- AI / Workflow Competitive Battlegrounds - Ultrasound
- Company Spotlights
- BrightHeart
- Caption Health / GE HealthCare
- UltraSight
- Ultrasound AI
- AS Software
- Intelligent Ultrasound / Surgical Science
- Us2.ai
- DiA Imaging Analysis / Philips
- Koios Medical
- MyCardium AI
- Sonio / Samsung Medison
- Ultromics
- Diagnoly
- AISAP
- Biotics AI
- DeepHealth / See-Mode
- MediReport
- HeartFocus / DESKi
- ThinkSono
- PIUR Imaging
- NerveBlox
- Qure.ai
- ESI
- DolphinSonic
- HeartLab
- 4.7 Cluster 5 - Frontier / Wearable / Hybrid / Therapeutic / Intervention
- Cluster Landscape (How Competition Works)
- Frontier Ultrasound Sub-Cluster Map
- Company Spotlights
- Sonus Microsystems
- HistoSonics
- iSono Health
- MAUI Imaging
- Oxailis
- Resolve Stroke
- Softsonics
- Evident Vascular
- Flosonics Medical
- Seno Medical
- Ventripoint Diagnostics
- Sonic Incytes
- EndoSound
- DeepSight Technology
- Laza Medical
- Merge Labs
- Petal Surgical
- EXACT Therapeutics
- SonALAsense
- SecondWave Systems
- SuperSonic Imagine
- Carthera
- OxSonics Therapeutics
- Openwater
- Sanmai Technologies
- Brainsonix
- Gestalta
- MicroPort Lifesciences
- 4.8 Cluster 6 - Semiconductor / Transducer / Infrastructure / Enabling Technology
- Cluster Landscape (How Competition Works)
- Enabling Stack Map - Upstream Control Points in Ultrasound
- Company Spotlights
- Infineon Technologies
- TTP
- Verasonics
- Vermon
- imec
- TRS Technologies
- TSMC
- NVIDIA
- NICAMED
- Intelerad Medical Systems
- RadNet / DeepHealth
- iCAD
- Konica Minolta
- Boston Scientific
- 4.9 Cluster 7 - China-Specific Vendors / Local Ecosystem
- Cluster Landscape (How Competition Works)
- China Ultrasound Ecosystem Map - Role Structure, Not Share Claim
- Company Spotlights
- Mindray
- SonoScape
- Chison
- Fiyano
- Shantou Ultrasound / SIUI
- Huasheng Medical
- Wandong Medical
- NICAMED
- ESI
- DolphinSonic
- United Imaging Healthcare
SECTION 5 - REGIONAL/COUNTRY MARKET ANALYSIS
- 5.1 North America Ultrasound Market
- Key Takeaways
- Market Landscape
- North America Country Contribution
- North America Market Snapshot
- North America Systems Layer
- What is Common vs. What Diverges Across the Two Countries
- North America Ecosystem Layer & AI Bridge
- North America Market Structure Views
- Bottom Line
- 5.2 United States Ultrasound Market
- What Matters, Why It Moves, And Where Value Accrues
- U.S. Market Landscape
- Market Snapshot
- U.S. Ultrasound Ecosystem Revenue Forecast
- Demand and Utilization Economics
- Fleet Economics and Replacement Dynamics
- Technology Mix Shift
- U.S. Ultrasound Growth-Engine Matrix
- AI Layer in the U.S.
- Competitive and Commercial Dynamics (U.S. Lens)
- Signals to Watch (Next 12-24 Months; U.S.)
- U.S. Market Estimates and Forecasts - Core Model
- U.S. Market Structure Snapshot - Market Structure Views
- U.S. Ultrasound Market Strategic Takeaways
- Implications
- Canada Ultrasound Market
- Key Takeaways
- Market Landscape
- Market Snapshot
- Canada - Ultrasound Systems Layer
- Canada Growth-Engine Matrix
- Canada Systems Growth Bridge
- Canada - Ultrasound ecosystem layer and AI bridge
- Canada Market Structure Snapshot - Market Structure Views
- Demand, Reimbursement, And Commercial Structure
- Bottom Line
- 5.3 APAC Ultrasound Market
- Key Takeaways
- Market Landscape
- What Is Common, And Where APAC Splits
- APAC Country Monetization / Growth Profile
- APAC Market Snapshot
- APAC Systems Layer
- APAC Ecosystem Layer & AI Bridge
- APAC End-Market Profile by Country
- APAC Market Structure Views
- Bottom Line
- 5.4 China Ultrasound Market
- Key Takeaways
- Market Landscape
- China Market Snapshot
- China - Ultrasound Systems Layer
- China Growth-Engine Matrix
- China Systems Growth Bridge
- China - Ultrasound Ecosystem Layer and AI Bridge
- Demand, Procurement, And Commercial Structure
- China Market Structure Views
- Bottom Line
- 5.5 Japan Ultrasound Market
- Key Takeaways
- Market Landscape
- Japan Market Snapshot
- Japan Systems Layer
- Japan Growth-Engine Matrix by Hardware Segment
- Japan Systems Growth Bridge
- Japan Ecosystem Layer and AI Bridge
- Demand, Reimbursement, And Commercial Structure
- Japan Market Structure Views
- Bottom Line
- 5.6 India Ultrasound Market
- Key Takeaways
- Market Landscape
- India Market Snapshot
- India Systems Layer
- India Growth-Engine Matrix
- India Systems Growth Bridge
- India Ecosystem Layer and AI Bridge
- Demand, Reimbursement, And Commercial Structure
- India Market Structure Views
- Bottom Line
- 5.7 Rest of Asia-Pacific (ROAPAC) Ultrasound Market
- Key Takeaways
- Market Landscape
- Regional Cluster Lens (How to Read ROAPAC)
- ROAPAC Market Snapshot
- ROAPAC Systems Layer
- ROAPAC Growth-Engine Matrix
- ROAPAC Ecosystem Layer and AI Bridge
- ROAPAC Systems Growth Bridge
- Demand And Utilization Economics
- Competitive And Commercial Dynamics
- Signals to Watch
- ROAPAC Market Structure Views
- Bottom Line
- 5.8 Europe Ultrasound Market
- Key Takeaways
- Market Landscape
- What Is Common, And Where Does Europe Split?
- Europe Country Monetization / Growth Profile
- Europe Market Snapshot
- Europe Systems Layer
- Europe Ecosystem Layer & AI Bridge
- Europe End-Market Profile by Country
- Europe Market Structure Views
- Bottom Line
- Germany Ultrasound Market
- Key Takeaways
- Market Landscape
- Germany Market Snapshot
- Germany Systems Layer
- Germany Growth-Engine Matrix
- Germany Ecosystem Layer and AI Bridge
- Germany Systems Growth Bridge
- Demand, Reimbursement, And Commercial Structure
- Germany Market Structure Views
- Bottom Line
- France Ultrasound Market
- Key Takeaways
- Market Landscape
- France Market Snapshot
- France Systems Layer
- France - Ultrasound Growth-Engine Matrix by Hardware Segment
- France Ecosystem Layer and AI Bridge
- France - Ultrasound Systems Growth Bridge
- Demand, Reimbursement, And Commercial Structure
- France Market Structure Views
- Bottom Line
- UK Ultrasound Market
- Key Takeaways
- Market Landscape
- UK Market Snapshot
- UK Systems Layer
- UK Growth-Engine Matrix by Hardware Segment
- UK Ecosystem Layer and AI Bridge
- UK - Ultrasound Systems Growth Bridge
- Demand, Reimbursement, And Commercial Structure
- UK Market Structure Views
- Bottom Line
- Italy Ultrasound Market
- Key Takeaways
- Italy Market Landscape
- Italy Market Snapshot
- Territorial Care, Digital Readiness, And Procurement Structure
- Italy Growth-Engine Matrix by Hardware Segment
- Italy Systems Layer
- Italy Ecosystem Layer & AI Bridge
- Italy Systems Growth Bridge
- Italy Market Structure Views
- Bottom Line
- Rest of Europe (ROE) Ultrasound Market
- Key Takeaways
- Market Landscape
- Regional Cluster Lens (How to Read ROE)
- ROE Market Snapshot
- ROE Systems Layer
- ROE Growth Engine Matrix
- ROE Ecosystem Layer & AI Bridge
- ROE Systems Growth Bridge
- Demand, Reimbursement, And Commercial Structure
- ROE Market Structure Views
- Bottom Line
- LATAM Ultrasound Market
- Key Takeaways
- Market Landscape
- LATAM Market Snapshot
- LATAM Systems Layer
- LATAM Growth-Engine Matrix by Hardware Segment
- LATAM Ecosystem Layer & AI Bridge
- LATAM Systems Growth Bridge
- Demand, Procurement, And Commercial Structure
- LATAM Market Structure Views
- Bottom Line
- Middle East & Africa (MEA) Ultrasound Market
- Key Takeaways
- Market Landscape
- Regional Cluster Lens
- MEA Market Snapshot
- MEA Systems Layer
- MEA Growth-Engine Matrix
- MEA Ecosystem Layer & AI Bridge
- MEA - Ultrasound Systems Growth Bridge
- Demand, Procurement, And Commercial Structure
- MEA Market Structure Views
- Bottom Line
LIST OF FIGURES
- Figure 1: World Ultrasound Ecosystem Revenue by Stream
- Figure 2: Global Ultrasound Hardware Mix Shift - Revenue Share vs Unit Shipment Share
- Figure 3: World Ultrasound AI Value-Pool Bridge by Stream
- Figure 4: Global Ultrasound Value Migration Above the Probe
- Figure 5: Ultrasound Regional Market Opportunity Map - Scale vs Growth
- Figure 6: Ultrasound Market - Competitive Architecture At-a-Glance
- Figure 7: Ultrasound Horizon Methodology Architecture
- Figure 8: Ultrasound Horizon Program - Research Workflow
- Figure 9: Ultrasound Market Strategic Frameworks - From Model to Insight to Action
- Figure 10: Global Ultrasound Ecosystem Revenue Forecast
- Figure 11: Global Systems Revenue by Hardware Segment
- Figure 12: Global Ultrasound End-Market Mix (Ecosystem Revenue)
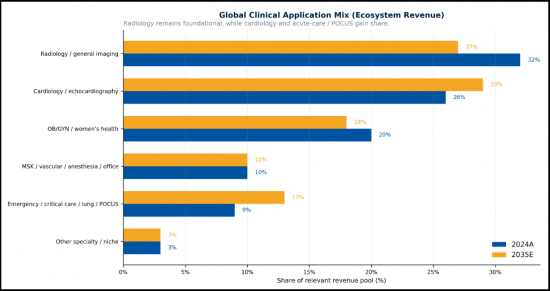
- Figure 13: Global Ultrasound Clinical Application Mix (Ecosystem Revenue)
- Figure 14: Global Ultrasound Purchase Model Mix
- Figure 15: Global Ultrasound Operating Model Mix
- Figure 16: Global Ultrasound AI Capability Mix
- Figure 17: Ultrasound Market Strategic Frameworks Architecture
- Figure 18: M3 Market Momentum Matrix (Global Ultrasound)
- Figure 19: M3 Market Momentum Matrix - Ultrasound Ecosystem Revenue Streams
- Figure 20: Ultrasound M-TEM (Technology Maturity Scoring)
- Figure 21: Ultrasound AI Revenue Bridge by Stream
- Figure 22: Ultrasound T-DIC (Technology Diffusion & Impact Curve)
- Figure 23: Solution Adoption & Growth Matrix - Ultrasound AI / Workflow Use Cases
- Figure 24: Ultrasound AI Use-Case Monetization Architecture
- Figure 25: GTM Growth-Maturity Matrix - Selected Ultrasound Ecosystem Players
- Figure 26: Ecosystem Collaboration Matrix - Ultrasound
- Figure 27: Ultrasound Control Plane Map - Distribution vs Workflow
- Figure 28: Partnering Decision Tree - Ultrasound AI / Workflow Commercialization
- Figure 29: ARC-Index - Ultrasound AI Capability Readiness
- Figure 30: Ultrasound Upgrade & Package Ladder
- Figure 31: Ultrasound AI Revenue Bridge
- Figure 32: Ultrasound Competitive Landscape Map - Cluster Universe View
- Figure 33: Ultrasound Market - Competitive Signal Scorecard
- Figure 34: Global Ultrasound Systems - OEM Share Structure (2024)
- Figure 35: Ultrasound Systems - Regional OEM Share Structure (2024)
- Figure 36: Handheld/POCUS Vendor Structure (2024)
- Figure 37: North America - Ultrasound Market Contribution by Country
- Figure 38: North America - Care Model Divergence in Ultrasound Market Between US & Canada
- Figure 39: U.S. Ultrasound Ecosystem Revenue by Modeled Stream
- Figure 40: U.S. Ultrasound Growth-Engine Matrix by Hardware Segment
- FIGURE 41: U.S. AI VALUE POOL BRIDGE BY STREAM (2024A, 2030E, 2035E)
- Figure 42: U.S. Ultrasound Systems Growth Bridge
- Figure 43: Canada Ultrasound Growth-Engine Matrix by Hardware Segment
- Figure 44: Canada Ultrasound Systems Growth Bridge
- Figure 45: APAC Country Ultrasound Monetization / Growth Profile
- Figure 46: APAC End-Market Profile by Country
- Figure 47: China - Ultrasound Growth-Engine Matrix
- Figure 48: China - Ultrasound Systems Growth Bridge
- Figure 49: Japan - Ultrasound Growth-Engine Matrix by Hardware Segment
- Figure 50: Japan - Ultrasound Systems Growth Bridge
- Figure 51: India - Growth-Engine Matrix
- Figure 52: India - Systems Growth Bridge
- Figure 53: ROAPAC - Ultrasound Growth-Engine Matrix by Hardware Segment
- Figure 54: ROAPAC - Ultrasound Systems Growth Bridge
- Figure 55: Europe Ultrasound Country Monetization / Growth Profile
- Figure 56: Europe Ultrasound End-Market Profile by Country
- Figure 57: Germany - Ultrasound Growth-Engine Matrix by Hardware Segment
- Figure 58: Germany - Ultrasound Systems Growth Bridge
- Figure 59: France - Ultrasound Growth-Engine Matrix by Hardware Segment
- Figure 60: France - Ultrasound Systems Growth Bridge
- Figure 61: UK - Ultrasound Growth-Engine Matrix by Hardware Segment
- Figure 62: UK - Ultrasound Systems Growth Bridge
- Figure 63: Italy - Ultrasound Growth-Engine Matrix by Hardware Segment
- Figure 64: Italy - Ultrasound Systems Growth Bridge
- Figure 65: ROE Ultrasound Growth-Engine Matrix by Hardware Segment
- Figure 66: ROE Ultrasound Systems Growth Bridge
- Figure 67: LATAM - Ultrasound Growth-Engine Matrix by Hardware Segment
- Figure 68: LATAM - Ultrasound Systems Growth Bridge
- Figure 69: MEA - Ultrasound Growth-Engine Matrix by Hardware Segment
- Figure 70: MEA - Ultrasound Systems Growth Bridge
LIST OF TABLES
- Table 1: Global Ultrasound Executive Revenue Dashboard
- Table 2: Global Ultrasound Unit and Installed-Base Metrics
- Table 3: Global Ultrasound Hardware Structure and Mix Shift
- Table 4: Global Ultrasound AI Value-Pool Bridge - Executive View
- Table 5: Ultrasound Market - Regional Ecosystem Revenue Summary
- Table 6: Global Ultrasound Market Snapshot (Core Model)
- Table 7: Global Ultrasound Systems Revenue by Hardware Segment
- Table 8: Global End-Market Mix - Share and Reconciled Ecosystem Revenue (2024A Vs 2035E)
- Table 9: Global Clinical Application Mix - Share and Reconciled Ecosystem Revenue (2024a Vs 2035e)
- Table 10: Global Purchase Model Mix - Share and Reconciled Systems Revenue (2024A Vs 2035E)
- Table 11: Global Operating Model Mix - Share and Reconciled Ecosystem Revenue (2024A Vs 2035E)
- Table 12: Global AI Capability Mix - Share and Reconciled Core Ai Recurring Revenue (2024A vs 2035E)
- Table 13: M3 Market Momentum Matrix - Ultrasound System Segments
- Table 14: M3 Market Momentum Matrix - Ultrasound Ecosystem Revenue Streams
- Table 15: Ultrasound AI Revenue by Stream / Bridge View - Normalized Mix Display
- Table 16: Ultrasound AI Revenue Bridge - Commercial Interpretation and Packaging Logic
- Table 17: Handheld / POCUS Share Bands (2024A, Global; Directional)
- TABLE 18: NORTH AMERICA - ULTRASOUND MARKET SNAPSHOT (2024A, 2030E, 2035E, CAGR)
- Table 19: North America Ultrasound Systems Revenue by Hardware Segment (2024A, 2030E, 2035E, CAGR)
- Table 20: North America Ultrasound Systems Unit Shipments by Hardware Segment (2024A, 2030E, 2035E, CAGR)
- Table 21: North America Ultrasound Systems Installed Base by Hardware Segment (2024A, 2030E, 2035E, CAGR)
- Table 22: North America Core Ecosystem Revenue Streams (2024A, 2030E, 2035E, CAGR)
- TABLE 23: NORTH AMERICA AI VALUE-POOL REVENUE (2024A, 2030E, 2035E, CAGR)
- Table 24: North America Ecosystem Revenue by End-Market Mix (2024A, 2030E, 2035E, CAGR)
- Table 25: North America Ecosystem Revenue by Clinical Application Mix (2024A, 2030E, 2035E, CAGR)
- Table 26: North America Share of Systems Revenue by Purchase Model Mix (2024A, 2030E, 2035E, CAGR)
- Table 27: North America Ecosystem Revenue by Operating Model Mix (2024A, 2030E, 2035E, CAGR)
- TABLE 28: U.S. ULTRASOUND MARKET SNAPSHOT (2024A, 2030E, 2035E, CAGR)
- TABLE 29: U.S. ULTRASOUND MARKET - AI LAYER, USD MILL (2024A, 2030E, 2035E)
- Table 30: U.S. Ultrasound Market Share Structure by Vendor
- TABLE 31: U.S. ULTRASOUND MARKET SUMMARY (UNITS & REV) - 2024A, 2030E, 2035E
- Table 32: U.S. Ultrasound Unit Shipments by Hardware Segment - 2024A, 2030E, 2035E
- Table 33: U.S. Ultrasound Systems Rev by Hardware Segment - 2024A, 2030E, 2035E
- Table 34: U.S. Ultrasound Systems Installed Base by Hardware Segment - 2024A, 2030E, 2035E
- TABLE 35: U.S. ECOSYSTEM REVENUE BY END-MARKET MIX (2024A, 2030E, 2035E, CAGR)
- TABLE 36: U.S. ECOSYSTEM REVENUE BY CLINICAL APPLICATION MIX (2024A, 2030E, 2035E, CAGR)
- TABLE 37: U.S. SYSTEMS REVENUE BY PURCHASE MODEL MIX (2024A, 2030E, 2035E, CAGR)
- TABLE 38: U.S. ECOSYSTEM REVENUE BY OPERATING MODEL MIX (2024A, 2030E, 2035E, CAGR)
- TABLE 39: CANADA - ULTRASOUND MARKET SNAPSHOT (2024A, 2030E, 2035E, CAGR)
- Table 40: Canada - Ultrasound Systems Rev by Hardware Segment - 2024A, 2030E, 2035E
- Table 41: Canada - Ultrasound Unit Shipments by Hardware Segment - 2024A, 2030E, 2035E
- Table 42: Canada - Ultrasound Systems Installed Base by Hardware Segment - 2024A, 2030E, 2035E
- TABLE 43: CANADA - ULTRASOUND ECOSYSTEM REVENUE (2024A, 2030E, 2035E, CAGR)
- TABLE 44: CANADA - ULTRASOUND AI VALUE-POOL BRIDGE REVENUE (2024A, 2030E, 2035E, CAGR)
- TABLE 45: CANADA - ECOSYSTEM REVENUE BY END-MARKET MIX (2024A, 2030E, 2035E, CAGR)
- Table 46: Canada - Ecosystem Revenue by Clinical Application Mix (2024A, 2030E, 2035E, CAGR)
- TABLE 47: CANADA - SYSTEMS REVENUE BY PURCHASE MODEL MIX (2024A, 2030E, 2035E, CAGR)
- Table 48: Canada - Ecosystem Revenue by Operating Model Mix (2024A, 2030E, 2035E, CAGR)
- TABLE 49: APAC - ULTRASOUND MARKET SNAPSHOT (2024A, 2030E, 2035E, CAGR)
- Table 50: APAC - Ultrasound Systems Rev by Hardware Segment - 2024A, 2030E, 2035E
- Table 51: APAC - Ultrasound Unit Shipments by Hardware Segment - 2024A, 2030E, 2035E
- Table 52: APAC - Ultrasound Systems Installed Base by Hardware Segment - 2024A, 2030E, 2035E
- TABLE 53: APAC- ULTRASOUND ECOSYSTEM REVENUE (2024A, 2030E, 2035E, CAGR)
- TABLE 54: APAC - ULTRASOUND AI VALUE-POOL BRIDGE REVENUE (2024A, 2030E, 2035E, CAGR)
- TABLE 55: APAC ECOSYSTEM REVENUE BY END-MARKET MIX (2024A, 2030E, 2035E, CAGR)
- TABLE 56: APAC - ECOSYSTEM REVENUE BY CLINICAL APPLICATION MIX (2024A, 2030E, 2035E, CAGR)
- TABLE 57: APAC - SYSTEMS REVENUE BY PURCHASE MODEL MIX (2024A, 2030E, 2035E, CAGR)
- TABLE 58: APAC - ECOSYSTEM REVENUE BY OPERATING MODEL MIX (2024A, 2030E, 2035E, CAGR)
- TABLE 59: CHINA - ULTRASOUND MARKET SNAPSHOT (2024A, 2030E, 2035E, CAGR)
- Table 60: China - Ultrasound Systems Rev by Hardware Segment - 2024A, 2030E, 2035E
- Table 61: China - Ultrasound Unit Shipments by Hardware Segment - 2024A, 2030E, 2035E
- Table 62: China - Ultrasound Systems Installed Base by Hardware Segment - 2024A, 2030E, 2035E
- TABLE 63: CHINA - ULTRASOUND ECOSYSTEM REVENUE (2024A, 2030E, 2035E, CAGR)
- TABLE 64: CHINA - ULTRASOUND AI VALUE-POOL BRIDGE REVENUE (2024A, 2030E, 2035E, CAGR)
- TABLE 65: CHINA - ECOSYSTEM REVENUE BY END-MARKET MIX (2024A, 2030E, 2035E, CAGR)
- Table 66: China - Ecosystem Revenue by Clinical Application Mix (2024A, 2030E, 2035E, CAGR)
- TABLE 67: CHINA - SYSTEMS REVENUE BY PURCHASE MODEL MIX (2024A, 2030E, 2035E, CAGR)
- Table 68: China - Ecosystem Revenue by Operating Model Mix (2024A, 2030E, 2035E, CAGR)
- TABLE 69: JAPAN - ULTRASOUND MARKET SNAPSHOT (2024A, 2030E, 2035E, CAGR)
- Table 70: Japan - Ultrasound Systems Rev by Hardware Segment - 2024A, 2030E, 2035E
- Table 71: Japan - Ultrasound Unit Shipments by Hardware Segment - 2024A, 2030E, 2035E
- Table 72: Japan - Ultrasound Systems Installed Base by Hardware Segment - 2024A, 2030E, 2035E
- TABLE 73: JAPAN - ULTRASOUND ECOSYSTEM REVENUE (2024A, 2030E, 2035E, CAGR)
- TABLE 74: JAPAN - ULTRASOUND AI VALUE-POOL BRIDGE REVENUE (2024A, 2030E, 2035E, CAGR)
- TABLE 75: JAPAN - ECOSYSTEM REVENUE BY END-MARKET MIX (2024A, 2030E, 2035E, CAGR)
- Table 76: Japan - Ecosystem Revenue by Clinical Application Mix (2024A, 2030E, 2035E, CAGR)
- TABLE 77: JAPAN - SYSTEMS REVENUE BY PURCHASE MODEL MIX (2024A, 2030E, 2035E, CAGR)
- Table 78: Japan - Ecosystem Revenue by Operating Model Mix (2024A, 2030E, 2035E, CAGR)
- TABLE 79: INDIA - ULTRASOUND MARKET SNAPSHOT (2024A, 2030E, 2035E, CAGR)
- Table 80: India - Ultrasound Systems Rev by Hardware Segment - 2024A, 2030E, 2035E
- Table 81: India - Ultrasound Unit Shipments by Hardware Segment - 2024A, 2030E, 2035E
- Table 82: India - Ultrasound Systems Installed Base by Hardware Segment - 2024A, 2030E, 2035E
- TABLE 83: INDIA - ULTRASOUND ECOSYSTEM REVENUE (2024A, 2030E, 2035E, CAGR)
- TABLE 84: INDIA - ULTRASOUND AI VALUE-POOL BRIDGE REVENUE (2024A, 2030E, 2035E, CAGR)
- TABLE 85: INDIA - ECOSYSTEM REVENUE BY END-MARKET MIX (2024A, 2030E, 2035E, CAGR)
- Table 86: India - Ecosystem Revenue by Clinical Application Mix (2024A, 2030E, 2035E, CAGR)
- TABLE 87: INDIA - SYSTEMS REVENUE BY PURCHASE MODEL MIX (2024A, 2030E, 2035E, CAGR)
- Table 88: India - Ecosystem Revenue by Operating Model Mix (2024A, 2030E, 2035E, CAGR)
- TABLE 89: ROAPAC - ULTRASOUND MARKET SNAPSHOT (2024A, 2030E, 2035E, CAGR)
- TABLE 90: ROAPAC - ULTRASOUND SYSTEMS REV BY HARDWARE SEGMENT - 2024A, 2030E, 2035E
- Table 91: ROAPAC - Ultrasound Unit Shipments by Hardware Segment - 2024A, 2030E, 2035E
- Table 92: ROAPAC - Ultrasound Systems Installed Base by Hardware Segment - 2024A, 2030E, 2035E
- TABLE 93: ROAPAC - ULTRASOUND ECOSYSTEM REVENUE (2024A, 2030E, 2035E, CAGR)
- TABLE 94: ROAPAC - ULTRASOUND AI VALUE-POOL BRIDGE REVENUE (2024A, 2030E, 2035E, CAGR)
- TABLE 95: ROAPAC - ECOSYSTEM REVENUE BY END-MARKET MIX (2024A, 2030E, 2035E, CAGR)
- TABLE 96: ROAPAC - ECOSYSTEM REVENUE BY CLINICAL APPLICATION MIX (2024A, 2030E, 2035E, CAGR)
- TABLE 97: ROAPAC - SYSTEMS REVENUE BY PURCHASE MODEL MIX (2024A, 2030E, 2035E, CAGR)
- TABLE 98: ROAPAC - ECOSYSTEM REVENUE BY OPERATING MODEL MIX (2024A, 2030E, 2035E, CAGR)
- TABLE 99: EUROPE - ULTRASOUND MARKET SNAPSHOT (2024A, 2030E, 2035E, CAGR)
- Table 100: Europe - Ultrasound Systems Rev by Hardware Segment - 2024A, 2030E, 2035E
- Table 101: Europe - Ultrasound Unit Shipments by Hardware Segment - 2024A, 2030E, 2035E
- Table 102: Europe - Ultrasound Systems Installed Base by Hardware Segment - 2024A, 2030E, 2035E
- TABLE 103: EUROPE - ULTRASOUND ECOSYSTEM REVENUE (2024A, 2030E, 2035E, CAGR)
- TABLE 104: EUROPE - ULTRASOUND AI VALUE-POOL BRIDGE REVENUE (2024A, 2030E, 2035E, CAGR)
- TABLE 105: EUROPE- ECOSYSTEM REVENUE BY END-MARKET MIX (2024A, 2030E, 2035E, CAGR)
- Table 106: Europe - Ecosystem Revenue by Clinical Application Mix (2024A, 2030E, 2035E, CAGR)
- TABLE 107: EUROPE - SYSTEMS REVENUE BY PURCHASE MODEL MIX (2024A, 2030E, 2035E, CAGR)
- Table 108: Europe - Ecosystem Revenue by Operating Model Mix (2024A, 2030E, 2035E, CAGR)
- TABLE 109: GERMANY - ULTRASOUND MARKET SNAPSHOT (2024A, 2030E, 2035E, CAGR)
- Table 110: Germany - Ultrasound Systems Rev by Hardware Segment - 2024A, 2030E, 2035E
- Table 111: Germany - Ultrasound Unit Shipments by Hardware Segment - 2024A, 2030E, 2035E
- Table 112: Germany - Ultrasound Installed Base by Hardware Segment - 2024A, 2030E, 2035E
- TABLE 113: GERMANY - ULTRASOUND ECOSYSTEM REVENUE (2024A, 2030E, 2035E, CAGR)
- TABLE 114: GERMANY - ULTRASOUND AI VALUE-POOL BRIDGE REVENUE (2024A, 2030E, 2035E, CAGR)
- TABLE 115: GERMANY - ECOSYSTEM REVENUE BY END-MARKET MIX (2024A, 2030E, 2035E, CAGR)
- Table 116: Germany - Ecosystem Revenue by Clinical Application Mix (2024A, 2030E, 2035E, CAGR)
- TABLE 117: GERMANY - SYSTEMS REVENUE BY PURCHASE MODEL MIX (2024A, 2030E, 2035E, CAGR)
- Table 118: Germany - Ecosystem Revenue by Operating Model Mix (2024A, 2030E, 2035E, CAGR)
- TABLE 119: FRANCE - ULTRASOUND MARKET SNAPSHOT (2024A, 2030E, 2035E, CAGR)
- Table 120: France - Ultrasound Systems Rev by Hardware Segment - 2024A, 2030E, 2035E
- Table 121: France - Ultrasound Unit Shipments by Hardware Segment - 2024A, 2030E, 2035E
- Table 122: France - Ultrasound Systems Installed Base by Hardware Segment - 2024A, 2030E, 2035E
- TABLE 123: FRANCE - ULTRASOUND ECOSYSTEM REVENUE (2024A, 2030E, 2035E, CAGR)
- TABLE 124: FRANCE - ULTRASOUND AI VALUE-POOL BRIDGE REVENUE (2024A, 2030E, 2035E, CAGR)
- TABLE 125: FRANCE - ECOSYSTEM REVENUE BY END-MARKET MIX (2024A, 2030E, 2035E, CAGR)
- Table 126: France - Ecosystem Revenue by Clinical Application Mix (2024A, 2030E, 2035E, CAGR)
- TABLE 127: FRANCE - SYSTEMS REVENUE BY PURCHASE MODEL MIX (2024A, 2030E, 2035E, CAGR)
- Table 128: France - Ecosystem Revenue by Operating Model Mix (2024A, 2030E, 2035E, CAGR)
- TABLE 129: UK - ULTRASOUND MARKET SNAPSHOT (2024A, 2030E, 2035E, CAGR)
- Table 130: UK - Ultrasound Systems Rev by Hardware Segment - 2024A, 2030E, 2035E
- Table 131: UK - Ultrasound Unit Shipments by Hardware Segment - 2024A, 2030E, 2035E
- Table 132: UK - Ultrasound Systems Installed Base by Hardware Segment - 2024A, 2030E, 2035E
- TABLE 133: UK - ULTRASOUND ECOSYSTEM REVENUE (2024A, 2030E, 2035E, CAGR)
- TABLE 134: UK - ULTRASOUND AI VALUE-POOL BRIDGE REVENUE (2024A, 2030E, 2035E, CAGR)
- TABLE 135: UK - ECOSYSTEM REVENUE BY END-MARKET MIX (2024A, 2030E, 2035E, CAGR)
- TABLE 136: UK - ECOSYSTEM REVENUE BY CLINICAL APPLICATION MIX (2024A, 2030E, 2035E, CAGR)
- TABLE 137: UK - SYSTEMS REVENUE BY PURCHASE MODEL MIX (2024A, 2030E, 2035E, CAGR)
- TABLE 138: UK - ECOSYSTEM REVENUE BY OPERATING MODEL MIX (2024A, 2030E, 2035E, CAGR)
- TABLE 139: ITALY - ULTRASOUND MARKET SNAPSHOT (2024A, 2030E, 2035E, CAGR)
- Table 140: Italy - Ultrasound Systems Rev by Hardware Segment - 2024A, 2030E, 2035E
- Table 141: Italy - Ultrasound Unit Shipments by Hardware Segment - 2024A, 2030E, 2035E
- Table 142: Italy - Ultrasound Systems Installed Base by Hardware Segment - 2024A, 2030E, 2035E
- TABLE 143: ITALY - ULTRASOUND ECOSYSTEM REVENUE (2024A, 2030E, 2035E, CAGR)
- TABLE 144: ITALY - ULTRASOUND AI VALUE-POOL BRIDGE REVENUE (2024A, 2030E, 2035E, CAGR)
- TABLE 145: ITALY - ECOSYSTEM REVENUE BY END-MARKET MIX (2024A, 2030E, 2035E, CAGR)
- Table 146: Italy - Ecosystem Revenue by Clinical Application Mix (2024A, 2030E, 2035E, CAGR)
- TABLE 147: ITALY - SYSTEMS REVENUE BY PURCHASE MODEL MIX (2024A, 2030E, 2035E, CAGR)
- Table 148: Italy - Ecosystem Revenue by Operating Model Mix (2024A, 2030E, 2035E, CAGR)
- TABLE 149: ROE - ULTRASOUND MARKET SNAPSHOT (2024A, 2030E, 2035E, CAGR)
- Table 150: ROE - Ultrasound Systems Rev by Hardware Segment - 2024A, 2030E, 2035E
- Table 151: ROE - Ultrasound Unit Shipments by Hardware Segment - 2024A, 2030E, 2035E
- Table 152: ROE - Ultrasound Systems Installed Base by Hardware Segment - 2024A, 2030E, 2035E
- TABLE 153: ROE - ULTRASOUND ECOSYSTEM REVENUE (2024A, 2030E, 2035E, CAGR)
- TABLE 154: ROE - ULTRASOUND AI VALUE-POOL BRIDGE REVENUE (2024A, 2030E, 2035E, CAGR)
- TABLE 155: ROE - ECOSYSTEM REVENUE BY END-MARKET MIX (2024A, 2030E, 2035E, CAGR)
- TABLE 156: ROE - ECOSYSTEM REVENUE BY CLINICAL APPLICATION MIX (2024A, 2030E, 2035E, CAGR)
- TABLE 157: ROE - SYSTEMS REVENUE BY PURCHASE MODEL MIX (2024A, 2030E, 2035E, CAGR)
- TABLE 158: ROE - ECOSYSTEM REVENUE BY OPERATING MODEL MIX (2024A, 2030E, 2035E, CAGR)
- TABLE 159: LATAM - ULTRASOUND MARKET SNAPSHOT (2024A, 2030E, 2035E, CAGR)
- TABLE 160: LATAM - ULTRASOUND SYSTEMS REV BY HARDWARE SEGMENT - 2024A, 2030E, 2035E
- Table 161: LATAM - Ultrasound Unit Shipments by Hardware Segment - 2024A, 2030E, 2035E
- Table 162: LATAM - Ultrasound Systems Installed Base by Hardware Segment - 2024A, 2030E, 2035E
- TABLE 163: LATAM - ULTRASOUND ECOSYSTEM REVENUE (2024A, 2030E, 2035E, CAGR)
- TABLE 164: LATAM - ULTRASOUND AI VALUE-POOL BRIDGE REVENUE (2024A, 2030E, 2035E, CAGR)
- TABLE 165: LATAM - ECOSYSTEM REVENUE BY END-MARKET MIX (2024A, 2030E, 2035E, CAGR)
- TABLE 166: LATAM - ECOSYSTEM REVENUE BY CLINICAL APPLICATION MIX (2024A, 2030E, 2035E, CAGR)
- TABLE 167: LATAM - SYSTEMS REVENUE BY PURCHASE MODEL MIX (2024A, 2030E, 2035E, CAGR)
- TABLE 168: LATAM - ECOSYSTEM REVENUE BY OPERATING MODEL MIX (2024A, 2030E, 2035E, CAGR)
- TABLE 169: MEA - ULTRASOUND MARKET SNAPSHOT (2024A, 2030E, 2035E, CAGR)
- Table 170: MEA - Ultrasound Systems Rev by Hardware Segment - 2024A, 2030E, 2035E
- Table 171: MEA - Ultrasound Unit Shipments by Hardware Segment - 2024A, 2030E, 2035E
- Table 172: MEA - Ultrasound Systems Installed Base by Hardware Segment - 2024A, 2030E, 2035E
- TABLE 173: MEA - ULTRASOUND ECOSYSTEM REVENUE (2024A, 2030E, 2035E, CAGR)
- TABLE 174: MEA - ULTRASOUND AI VALUE-POOL BRIDGE REVENUE (2024A, 2030E, 2035E, CAGR)
- TABLE 175: MEA - ECOSYSTEM REVENUE BY END-MARKET MIX (2024A, 2030E, 2035E, CAGR)
- TABLE 176: MEA - ECOSYSTEM REVENUE BY CLINICAL APPLICATION MIX (2024A, 2030E, 2035E, CAGR)
- TABLE 177: MEA - SYSTEMS REVENUE BY PURCHASE MODEL MIX (2024A, 2030E, 2035E, CAGR)
- TABLE 178: MEA - ECOSYSTEM REVENUE BY OPERATING MODEL MIX (2024A, 2030E, 2035E, CAGR)

